Author: Zara Qadir

Sucking out the carbon from the atmosphere- can negative emissions technologies help reach climate goals?

A blog post from Dr Jasmin Cooper, Research Associate at the Department of Chemical Engineering and Sustainable Gas Institute.

The atmospheric concentration of carbon dioxide is continuing to rise despite global efforts to decarbonise energy systems and economies. There was a dip in emissions during periods of national lockdown in the 2020 COVID-19 pandemic but as lockdown measures ease, emissions are returning to pre-pandemic levels (Met Office, 2021). It has become evident that the rate of decarbonisation is not matching the pace needed to meet the climate change goals set in the Paris Agreement and therefore cutting fossil fuels alone is not enough to keep global warming to below 2°C or 1.5°C (McGrath, 2020). Therefore, negative emission technologies (NET), such as those which ‘suck’ carbon dioxide out of the atmosphere, have an important role to play in meeting emission targets.

What are NET?

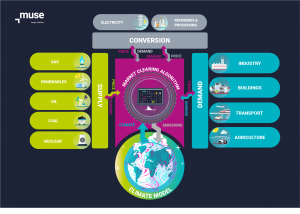
There are a number of emerging NET being used or are emerging, including afforestation and reforestation, direct air capture and bioenergy with carbon capture, some of which are on display in the Science Museum’s Our Future Planet exhibition. These are different to carbon capture for a coal power plant as they remove pre-existing carbon dioxide from the atmosphere, therefore reducing the atmospheric concentration.

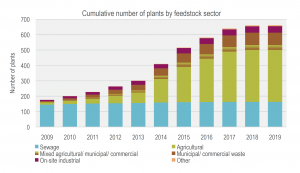
Each NET has its pros and cons; afforestation is simple yet effective but requires large numbers of trees (and therefore land) to be planted in order for significant carbon removal. Bioenergy with carbon capture is multifunctional as it generates heat, electricity or liquid fuels, but the feedstock requirements could conflict with other agricultural needs.

Our work on the environmental impacts of NET

At the Sustainable Gas Institute, we have been examining the environmental impacts of NET. Important factors of all NET are their embodied emissions (emissions from the production of materials and energy used by a NET) and life cycle impacts (impacts from all activities, materials and energy consumed by a NET over its entire lifespan). If these are high, then the overall climate change mitigation effectiveness of a NET could be severely reduced. For example, if a NET emits 400 kg CO2eq. per one ton of carbon dioxide removed from the atmosphere, then the total amount of carbon dioxide removed is 600 kg. Emissions occur in the materials and energy supply chains, as well as during activities in the life cycle such as maintenance, construction and waste management. Emissions are not limited to greenhouse gases.

Other chemicals are released into the atmosphere that can have negative impacts to air quality, land and water. No NET is emission free, and the magnitude of emissions ranges greatly both between and within NET, depending on the quantity of materials and energy used and the level of decarbonisation within the materials and energy supply chains. Therefore, it is important that these emissions are taken into consideration when developing NET strategies.

Rate of carbon dioxide removal

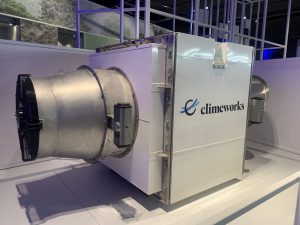
Another important factor to consider is the amount of carbon dioxide removed over time. Afforestation and reforestation and enhanced weathering can remove large quantities of carbon dioxide from the atmosphere, but the rate of removal is slow and dependant on factors such as temperature. Direct air capture and bioenergy with carbon capture, on the other hand, can remove large quantities of carbon dioxide from the atmosphere quickly, with capacities of one to four megatons of carbon dioxide per year per facility. However, they are the most sensitive to emissions from their supply chains. Hence, forward planning is an important factor that should be taken into account when devising NET strategies so that variations in rate of carbon dioxide removal are taken into account.

Weighing up the evidence

Overall, NETs do result in a net removal of carbon dioxide across their life cycle but under particular circumstances, the impact of embodied emissions can be so great that there is limited net carbon removal. Therefore, we need to maximise the effectiveness of NET as this is crucial for ensuring no repercussion are experienced from expanding their uptake globally and that there are no further delays to reaching Paris Agreement targets.

References

McGrath, M. 2020. ‘Not enough’ climate ambition shown by leaders. BBC News, 12 December 2020.
Met Office. 2021. Mauna Loa carbon dioxide forecast for 2021 [Online]. London, UK. Available: https://www.metoffice.gov.uk/research/climate/seasonal-to-decadal/long-range/forecasts/co2-forecast [Accessed June 2021 2021].


Creating a Global Energy Systems Model – Dr Sara Giarola

Picture of Dr Sara Giarola
Dr Sara Giarola

We recently interviewed Dr Sara Giarola, Research Fellow at the Sustainable Gas Institute and the lead modeller for the energy systems model, MUSE. We asked her about how policymakers in governments are using MUSE and other models to inform their decision making for COP-26.

What is an energy systems model? Why are they important?

It was the Oil crisis in the 1970s that prompted the development of tools which described the links between energy supply, demand, and their impact on the energy security of many nations in the world. These tools were the first known energy system models.

An energy system model is a mathematical representation of the sources of energy (e.g. renewables and fossil fuels), the destinations for energy (or “end-uses”, which include all the diverse needs of energy of our society, from the electricity consumed in our houses to the electricity used to run electric vehicles), and all the possible ways with which energy can transform from one to another form. For example, wind power can be converted into electricity in wind farms and distributed to our households.

Energy system models can be quite diverse. However, their communal strength relies in combining energy technologies, with environmental (for example, the interactions between energy and climate) and societal factors, and different policies. This makes them privileged tools to evaluate the implications of climate policies and industrial strategies.

What is your background?

Being a chemical engineer, I have always been fascinated by mathematics, especially when used to describe phenomena occurring at any scale, from chemical reactions to interconnected macro-systems. Since my PhD, which was on the optimisation of biofuels in transport, I became interested in energy problems and made energy system modelling one of my main research interests.

A diagram showing MUSE
A diagram of MUSE

What is unique about MUSE?

MUSE (ModUlar energy system Simulation Environment) models all the possible ways in which energy can be transformed on a global scale. It differs from existing models in many ways, but the agent-based nature of the model is particularly important. Models attempt to capture the behaviour of individuals within an environment. MUSE has an accurate description of the investment and operational decisions made in each geographical region and sector.

MUSE, not only describes each energy sector model (e.g., natural gas or renewables) presenting a comprehensive picture of all technologies in the sector, but also captures the diversity of drivers. These drivers are what lead firms and consumers to buy a specific energy technology rather than another one, and build upon factors such as education level, wealth, principles, and socio-cultural context.

How can modellers help policy makers?

In compliance with the Paris Agreement, governments need to take fundamental decisions around their plans of actions for reducing the greenhouse emissions. Energy models can be used to run “what-if” analyses asking questions around the shape of the energy mix in the future. Many of applications will be published in an IPCC Assessment report to be published in 2022.

The upcoming UN Climate Change Conference of the Parties (COP26), will be a milestone review of current achievements and future targets in the decarbonisation process. One of the key questions which the world will have to face will be around securing a global net-zero target by 2050 while keeping the 1.5 degrees limit in temperature increase compared to pre-industrial time. In order to answer this question, the modelling community has been involved in an unprecedented effort to help provide evidence through model inter-comparison studies to help facilitate transparent and robust dialogue between stakeholders.

Who has been interested in the model? Who have you worked with?

MUSE is part of the the Paris Reinforce project and of the Climate Compatible Growth (CCG) programme.

Paris Reinforce builds upon an extensive modelling ensemble comprising five national/regional models for Europe, nine national models for countries outside of Europe, and eight global models. The project focuses on assessing climate policy decision within structured frameworks created around model inter-comparison studies in view of reaching the Paris Agreement targets, building bolder ambitions from existing Nationally Determined Contributions (NDCs) and National Economic and Climate Plans (NECPs).

CCG is a UK-research programme developed in preparation for COP26 to support investment in sustainable energy. Among the many research outputs, CCG analysts have produced a multi-model comparison study where four global energy system models and selected power sector models, were used to investigate the timing and rate of the global coal phase out, which is essential to foster a Paris Agreement-complaint energy system.

What challenges have you faced?

wind energy farm
Wind farm (Source: Pixabay)

One of the main difficulties of the energy system models, is to translate into research questions stakeholders’ concerns: workshops and surveys are important to identify their priorities. Similarly, translating the research finding into a message to policymakers and stakeholders could also be challenging, as models always bear a certain level of approximation of the real-world phenomena due to their inherent mathematical description.

What surprises have you come across?

It is interesting to see where major barriers to decarbonisation may lie. We recently modelled the real market segmentation of the ammonia industry in China, the biggest world ammonia manufacturer. As enterprises vary in size and governance, a net-zero transition becomes less favoured if specific policy mechanisms are absent to ensure competitivity. Therefore, in China, a net-zero ammonia industry would need to go beyond the unique implementation of a carbon tax and adopt more sophisticated subsidy schemes to allow the transition for enterprises with lower access to capital.

How can one find out more?

Information on the MUSE model can be found on the new Imperial College microsite, where you will see who is working on the model, our publications, and of stories from researchers sharing their views on the energy system transformations.

We will also launch our energy system simulator in the next month, where you can explore how the energy mix might evolve between now and 2100.

MUSE will soon be available as an open source software on a Github where you can copy the code, learn how the model works, and suggest ways to improve it, in a truly transparent global collaboration.

https://www.youtube.com/watch?v=L37WTkNDlD4

Methane emissions from biogas facilities are underestimated

A blog by Dr Semra Bakkaloglu, a Research Associate at the Sustaianable Gas Institute. 

Biogas production could have an important role in renewable energy, reducing the adverse effects on the climate. However, biogas production’s contribution to emissions of the greenhouse gas, methane, is not fully understood. Methane (CH4) is the second most potent and abundant greenhouse gas after carbon dioxide (CO2) but because it only lasts in the atmosphere for short time (a decade) reducing methane emissions could have a more rapid impact on mitigating climate change. Unfortunately, there are significant discrepancies between official inventories of methane emissions and estimates derived from direct atmospheric measurement of biogas plants.  If biogas is to be a solution to climate change, we need to find effective emission methane reduction strategies, and sources also need to be properly quantified.

What is biogas?

According to the United Nations Framework Convention on Climate Change (UNFCCC), biogas is defined as gas generated from anaerobic digesters. Biogas plant feed may be any biodegradable material, such as dedicated energy crops, agricultural residues, organic waste and paper mill waste. The integrated process in biogas plants includes feedstock supply and pre-treatment, gas treatment and utilisation, and recovery, pre-treatment and use of digestate (Wellinger et al., 2013). This comprises 50 to 70% methane, 30 to 50% CO2 and traces (1 to 5%) of hydrogen suphide and ammonia (National Non-Food Crops Centre, 2021). Biogas is used for heating, electricity or both. If biogas is upgraded to biomethane by removing other gases, biomethane has similar properties to natural gas and can be injected into gas grid or used as a road fuel.

Emissions from biogas plants

Biogas production has an important place in renewable energy, reducing the adverse effects on the climate. However, high methane emissions from biogas plants can arise from fugitive emissions. Depending on engine construction, plant design and operation conditions, emissions can occur through venting from compressors, pipes, single large leaks or long-lasting pressure relief valves and incomplete combustions from combined heat and power units.

Biogas plant and field
Figure 1: One of the UK’s biogas plants

Biogas plants not accounted for

Waste practices in the EU and the UK have changed recently as more waste is being diverted from landfill to biogas plants and composting facilities. There are 579 biogas plants in the UK (National Non-Food Crops Centre, 2021) and their number of biogas plants has grown in the last decade (Figure 2). Unfortunately, most have not been included in the National Atmospheric Emission Inventory (NAEI).

The sustainability of biogas plants depends on the land requirement and greenhouse gas accounting (OFGEM, 2018). However, studies have shown that there is often a maximum loss of 9% of the total production rate of methane (Bakkaloglu et al., 2021; Scheutz and Fredenslud, 2019, and Samuelsson et al. 2018). Also, research conducted by my colleagues and I at Royal Holloway in 2021, demonstrated that biogas plants emissions may account for up to 3.8% of the total methane emissions in the UK. This does not include the sewage sludge biogas plants. We therefore need robust, consistent emission measurements in the UK. Legal requirements should also be implemented, not only UK Net Zero Commitment, but also for the sustainability of biogas plants.

Biogas in the UK’s Net-Zero Commitment

Figure 2. Biogas plant market in the UK (Source: Anaerobic Digestion and Bioresources Association, 2019)

On 27 June 2019, the UK government committed to achieving net-zero Carbon emissions by 2050, in line with the UN’s Paris Agreement (Climate Change Committee, 2019). This Agreement sets out many recommendations as to how to achieve net-zero targeted, including:

  • Diversion of all biodegradable waste from landfills to anaerobic digesters or composting facilities by 2025.
  • Measures to reduce emissions from livestock, soils and waste manure.
  • Elimination of food waste as far as possible, and separation of food waste collections
  • Full utilisation of the UK’s biogenic waste sources, including residues from agriculture and forestry.

According to a recent article on the UN website in December 2020, more than 110 countries have a carbon neutral strategy by 2050 but this aim can only be achieved with appropriate reduction methods. As a result of this zero-commitment, biogas plants have assumed a more significant role, not only in the renewable energy market but also in waste strategies.

Although emissions from biogas plants have not, as yet, attracted serious attention, they may jeopardise the net-zero commitment unless the necessary action is taken.

References

What are the best options for road freight transport?

Pedro Gerber Machado, a visiting researcher from the University of São Paulo, Brazil, summarises his recent review paper examining the life cycle emissions for road freight transport. The review was carried out in collaboration with the Institute of Energy and Environment at the University of São Paulo, Brazil.

Author: Pedro Gerber Machado

The transport sector is responsible for around 30% of the world’s energy consumption and 16% of greenhouse gases (GHG) emissions.  To achieve an energy transition to guarantee net-zero emissions, reducing emissions from road transport is fundamental. Diesel is still the most common fuel used for heavy road transport and freight. While worldwide there is a move towards electric vehicles, their environmental benefit in reducing emissions depends on the area’s electricity sources. Our review paper examines the total environmental life cycle emissions of different fuel options and technologies for road freight transport (trucks) in 45 studies.

Electric vehicle
Source: Pixabay

Source of electricity

The source of electricity can make a big difference to greenhouse gas emissions. We found that with greenhouse gas emissions, higher values (3,148–3,664 g/km) are found in places where coal has a significant share in electricity generation. Lower emissions are found where renewables have higher percentages in electricity generation (496 g/km). In China, emissions can reach 5,479 g/km since electricity generation “is mostly from coal.”

Compressed Natural Gas (CNG)

For Compressed Natural Gas (CNG) technology, greenhouse gas emissions vary due to differing efficiency and assumptions about methane leakage during natural gas transportation. But future projections are optimistic due to the potential for improvements in controlling methane emissions (514 g/km in 2050).

Biodiesel

In the analysis, biodiesel had a higher energy consumption and higher emissions profile in the production phase equal to diesel, which is the main reason for its low environmental performance.

Hydrogen

The greenhouse gas emissions intensity from hydrogen varies as it is depends on its method of production such as coal gasification, steam methane reforming (SMR), and hydrolysis. The use of carbon capture and storage (CCS) and liquid or gaseous use also influences its final emission profile.

Fuels vs. diesel

On average, the review showed that biogas, fuel-cell hydrogen, and Liquefied Natural Gas (LNG) have lower emissions in their life cycle than diesel, with a chance of a 57% reduction in emissions for biodiesel, 77% for fuel-cell hydrogen, and 100% chance for biogas. Interestingly, even though biodiesel is a renewable source of fuel that receives significant attention due to its capacity to reduce greenhouse gas emissions, in our review, it had a higher average emission than diesel.

Electric car
Source: Pixabay

Battery electric, hydrogen fuel cells and biogas

We found that if a clean electricity matrix is available, with high renewable energy shares, battery electric vehicles provide the best option. Hydrogen fuel-cells, when hydrogen comes from renewable sources, are also comparable to battery electric vehicles. Biogas can serve as a feedstock for hydrogen production in substituting natural gas in steam methane reform or liquefied for use in Liquid Natural Gas (LNG) trucks.

Further research into biogas emissions, fuel consumption, and its economics is essential. Since biogas production is possible from several sources, it could be suitable for different countries, such as Brazil.

Analysing air pollutants

There is a lack of studies exploring the life cycle of these options when it comes to air pollutants. Even though pollutant emissions in the use phase (for internal combustion options) have received more attention from the scientific community, emissions for the whole life cycle should also be studied. Even so, uncertainties related to the Tank-to-Wheel evaluation can increase the inaccurate values from this side of the analysis and the error propagation, directly impacting the policymakers. For PM2.5, hybrid and LNG options have greater changes in reducing the emissions. Fuel-cell, LNG, CNG, and hybrid trucks have higher chances of reducing nitrogen oxide (NOx) emissions. In contrast, sulphur oxide (SOx) emissions came out inconclusive due to a lack of studies.

But what about the economics…

CNG, LNG, and hybrid trucks were the best options from an economic perspective. CNG has lower life cycle costs and fuel costs in most analyses, with values ranging from 50% lower life cycle costs than diesel to a 2% reduction, to 16% average increase. CNG is the most economical fuel for large fleets that conduct urban operations and can support private infrastructure.

LNG could have a payback time of 2.5 years or lower, considering the price differential mostly in long-haul operations due to its lower fuel costs. However, economic viability could be achieved due to the higher cost of LNG vehicles and maintenance and the limited range of LNG trucks relative to diesel. The studies also showed that the fuel efficiency in LNG trucks could dictate its economic viability. Relative efficiencies of less than 80% reduce the chances of lower costs by 50%.

Finally, hybrid trucks show a total life cycle cost from 10% lower to practically no difference. Although the incremental cost of hybrid trucks is expected to become close to zero in the future, additional investments of more than $35,000 in hybrid technology hinder its viability, especially with low diesel fuel costs.

In the developing world…

The question arises then if the best options regarding GHG and local pollutant emissions will ever be a possibility for developing regions. Even though authors point out that electric trucks could cause an increase in emissions in several places in the world and that it is still necessary to evaluate peak power demand to understand the operational aspects of transport electrification, electric trucks in countries with a high share of renewables have the most radical reductions in GHG. However, being the most expensive options, there is a slight chance that governments in poorer countries or even the private sector will be willing to pay the price, based solely on environmental reasons.

The way to go in these countries has been to continue to depend on diesel. Most recently, the discussion on natural gas use in the transport sector has gained some momentum. Cheaper than other alternative options, natural gas might be an option due to its lower PM emissions, even though other pollutants, or GHG emissions, are higher.