Blog posts

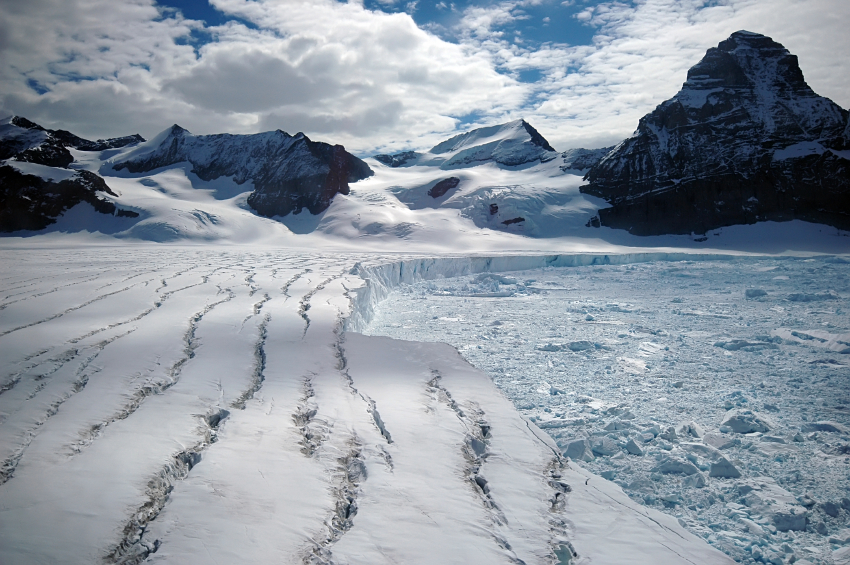
How will Antartica’s ice-sheet contribute to 21st century sea level rise?

by Professor Martin Siegert, Co-director, Grantham Institute

Antarctic glacierOn 27th October I convened a meeting at the Royal Society of London to discuss the results of a recent 20-year research horizon scanning exercise for Antarctic Science (Kennicutt et al. 2014). Part of the discussion focused on the research needed to better quantify Antarctica’s likely contribution to sea level rise in the coming decades and beyond, as published in the new Intergovernmental Panel on Climate Change (IPCC) Synthesis Report.

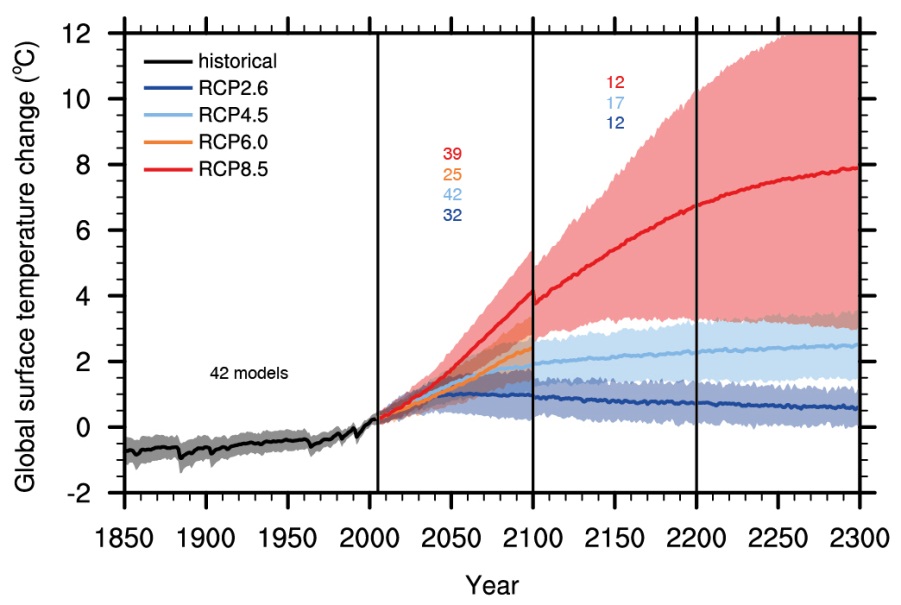
The report states that, ‘Global mean sea level rise will continue during the 21st century, very likely at a faster rate than observed from 1971 to 2010, and will likely be in the ranges of 0.26 to 0.55 m [in the lowest emissions scenario] … and … 0.45 to 0.82 m [in the highest emissions scenario – the closest to “business as usual”]’. It also states that, ‘Based on current understanding, only the collapse of marine-based sectors of the Antarctic ice sheet, if initiated, could cause global mean sea level to rise substantially above the likely range during the 21st century.’ There is medium confidence that any additional sea level rise would be no more than tens of centimetres.

One of the speakers at the event, Prof. David Vaughan, the Director of Research at the British Antarctic Survey, supported the IPCC’s position by remarking that he knew of no glaciologist who would strongly advocate a different position to this, given the evidence at hand. As a glaciologist myself, I can easily accept Prof. Vaughan’s comment and I don’t believe it is controversial among the community. I was, however, provoked by it to consider the relevant issues a little further, given the uncertainties noted by the IPCC, and to take the opportunity to discuss it with colleagues at the meeting.

  Could ice sheet collapse lead to further sea level rise?

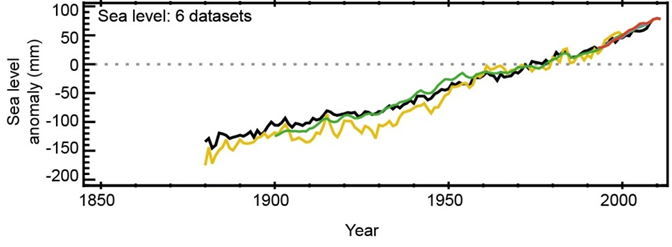
Historically, ice sheet responses to global warming have been responsible for sea level changes of a metre or more per century. As the glaciers retreated after the last ice age, sea levels rose by an average of over a metre per century between 20,000 years ago and 10,000 years ago – a total of 120 m. Records also show that the rate of sea level rise can exceed this, however. During the so-called ‘meltwater pulse 1a’ (MWP1a) episode around 15,000 years ago, an increase of around 7 m per century took place. The cause of MWP1a remains uncertain, with some pointing to the rapid decay of the North American ice sheet, whereas others link the change to Antarctica. It may be that both ice sheets were involved to some degree, and the details of the issue remain hotly debated. The point to note is that changes in the cryosphere are certainly capable of causing global sea level to rise at a higher rate than the IPCC suggests.

It is worth considering  whether we can rule out the possibility of a new meltwater pulse being locked in somewhere in Antarctica or Greenland, ready to be released to the ocean once some threshold has been reached. As the IPCC notes, several regions of the West Antarctic ice sheet (in particular) and East Antarctic ice sheet appear close to or at a physical threshold of change, where ground ice retreat into deeper (below sea level) terrain leads to further accelerated loss of ice to the sea (often referred to as marine ice sheet instability). Papers earlier this year by Joughin et al. (2014) and Rignot et al. (2014) point to such irreversible change having already begun in the Amundsen Bay region of West Antarctica. According to Joughin et al. (2014) the full effects of such change may take several hundred years, in line with the IPCC’s position. Evidence from the other side of West Antarctica demonstrates a region the size of Wales being highly sensitive to future ocean warming (Ross et al. 2012), and that such warmth may be delivered within a few decades (Hellmer et al. 2012). Across the continent in East Antarctica, the structure of the underlying bedrock reveals evidence of major ice recession in the past (Young et al. 2011), hinting that the ice sheet response to warming is not necessarily restricted to West Antarctica. Indeed while West Antarctica may be losing mass more quickly than anywhere else on the planet, the greatest potential for sea level change lies in East Antarctica, which about ten times greater in volume.

So, after considering Prof. Vaughan’s point that no glaciologist would differ markedly from the IPCC on Antarctic ice sheet collapse, I returned a question to him and those gathered: how can we be sure that the Antarctic ice sheet won’t respond to ocean warming more quickly than expected in certain regions? The answer is we can’t be certain even though, like Joughin et al. (2014), we may consider it unlikely. While I did not dispute Prof. Vaughan’s point, in the light of both recent findings and more established figures on how ice sheets can change during episodes of global warming, there is surely a non-zero risk of much greater sea level rise over the coming decades than the IPCC alludes to.

Quantifying this risk is difficult – maybe impossible at present – and as a consequence is likely to be highly controversial, which is why the IPCC does not tackle it. The problem is that quantifying a non-zero risk of global sea level rise over 1 m in the next 100 years is a far more challenging problem – for both scientists and decision makers – than restricting the debate to what we consider most likely. Maintaining this restriction on the debate is neither safe nor sensible, however.

Glaciologists will point to the research needed on the Antarctic ice sheet’s sensitivity to ocean warming to advance the debate. In 20 years as a glaciologist, I have been surprised on numerous occasions by what we discover about the flow and form of past and present ice sheets. I am utterly certain that amazing new discoveries lie ahead. For this reason, an appropriately sceptical scientific attitude is to accept that our knowledge of Antarctica remains woefully inadequate to be certain about future sea level rise, and to always challenge the consensus constructively.

The solution lies in our ability to model the ice-ocean system in a way that allows confident predictions of the ice sheet response to ocean warming. To do this we need two things. First is better input data, by way of high-precision landscaping beneath the ice sheet in regions most sensitive to change, and in areas where no data have been collected (and there are several completely unexplored parts of the continent). The data collected would also allow us to better understand the process of ice flow in key regions of potential change. A second advance needed is in the coupling of ice-sheet and ocean models. Both are challenging, but well within our abilities to achieve them. Indeed the horizon scanning exercise discussed last week made such investigations a priority.

The costs of decarbonising the UK

By Dr Flora WhitmarshGrantham Institute

money200
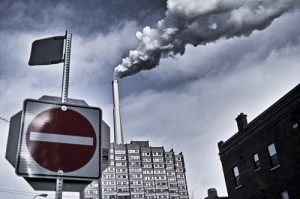
The costs associated with reducing emissions in the UK have been discussed recently in the press. In an article in the Mail on Sunday, David Rose made the claim that energy policies shaped by the so-called “Green Blob” –  a term coined by Owen Paterson for what he called “the mutually supportive network of environmental pressure groups, renewable energy companies and some public officials” – will cost the UK up to £400 billion by 2030, and that bills will rise by at least a third.

How much will action on climate change actually cost? The quoted figure of £400 billion equates to 1-1.5% of cumulative UK GDP over the next sixteen years. The most recent analysis to be carried out by the Intergovernmental Panel on Climate Change suggests that the costs of a low carbon economy would be around 1-4% of GDP globally by 2030. Analysis carried out by the AVOID consortium which includes Grantham Institute researchers found that the costs of staying within 2oC were 0.5-4% of global GDP, and a report on the costs of mitigation co-authored by the Grantham Institute put the costs at around 1% of global GDP. The figure quoted in the Mail on Sunday for the overall costs of decarbonisation is of the order of magnitude projected by experts, but these figures do not take into account the co-benefits of mitigation such as improved air quality and energy security. In fact a recent report by Cambridge Econometrics asserts that the UK’s decarbonisation pathway would lead to a net increase in GDP of 1.1% by 2030, due to structural changes in the economy and job creation resulting from the low-carbon transition.

Whilst these estimates relate to the economy-wide cost of using low-carbon energy rather than carbon-intensive sources such as fossil fuels, it is not immediately clear from them what this means for the cost of living. The rising cost of household energy is a key concern for people in the UK who have already seen significant increases in the average bill since 2004 mainly due to the rising cost of gas. In a report published in 2012, the Climate Change Committee concluded that support for low carbon technologies would add an average of £100 (10%) onto energy bills for a typical household by 2020 – where a typical household is one that uses gas for heating, and electricity for lighting and appliances. A further increase of £25 per household is projected by 2030, but this is less than in a scenario with high levels of investment in gas-fired power generation.

Furthermore, this could be partially offset by improvements in energy efficiency. The Climate Change Committee expects that by 2020 the replacement of old inefficient boilers will reduce bills by around £35 on average. The use of more efficient lights and appliances could reduce bills by a further £85, and improved efficiency in heating, mainly due to insulation, could save another £25 on average. However, making these savings would depend on having the right policies in place to encourage energy efficiency.

In defence of biomass energy

By Professor Colin Prentice, AXA Chair in Biosphere and Climate Impacts

Further to previous posts on this blog regarding Owen Paterson’s recent speech to the Global Warming Policy Foundation, I would like to take this opportunity to correct his dismissive statement about biomass energy as a potential contribution to decarbonized energy production in the UK. This is what the former Environment Secretary said:

forest-272595_1280

Biomass is not zero carbon. It generates more CO2 per unit of energy even than coal. Even DECC admits that importing wood pellets from North America to turn into hugely expensive electricity here makes no sense if only because a good proportion of those pellets are coming from whole trees.

The fact that trees can regrow is of little relevance: they take decades to replace the carbon released in their combustion, and then they are supposed to be cut down again. If you want to fix carbon by planting trees, then plant trees! Don’t cut them down as well. We are spending ten times as much to cut down North American forests as we are to stop the cutting down of tropical forests.

Meanwhile, more than 90 percent of the renewable heat incentive (RHI) funds are going to biomass. That is to say, we are paying people to stop using gas and burn wood instead. Wood produces twice as much carbon dioxide than gas.

There are two misconceptions here.

(1) It is extremely relevant that ‘trees can regrow’ – this is the whole reason why biomass energy is commonly accounted as being carbon neutral! To be genuinely carbon neutral, of course, every tonne of biomass that is burnt (plus any additional greenhouse gas emissions associated with its production and delivery to the point of use) has to replaced by a tonne of new biomass that is growing somewhere else. This is possible so long as the biomass is obtained from a sustainable rotation system – that is, a system in which the rate of harvest is at least equalled by the rate of regrowth, when averaged over the whole supply region.

Now it has been pointed out several times in the literature (e.g. Searchinger et al., 2009; Haberl et al., 2012) that if biomass is burnt for energy and not replenished (for example, if trees are cut down and the land is then converted to other uses), then it is not carbon neutral. Indeed, the carbon intensity of this form of energy production is at least as high as that of coal. Paterson may have been influenced by a report on this topic (RSPB, Friends of the Earth and Greenpeace, 2012) which drew attention to the “accounting error” by which energy derived from biomass might be classed as carbon neutral while actually being highly polluting. But this refers to an extreme scenario, whereby increased demand for forest products leads to no increase in the area covered by forests. In this scenario, biomass energy demand would have to be met from the existing (global) forest estate, drawing down the carbon stocks of forests and forcing builders to substitute concrete and other materials for wood. This would certainly be undesirable from the point of view of the land carbon balance; and carbon accounting rules should recognize the fact.

Nonethless, this extreme scenario is implausible. It assumes that the value of biomass as fuel would be comparable to that of timber (highly unlikely) and more generally that there would be no supply response to increased demand. In more economically plausible scenarios, the increased demand for biomass fuel is met by an increase in the use of by-products of timber production (which today are commonly left to decay or burnt without producing any energy), and by an increase in the amount of agriculturally marginal land under biomass production – including non-tree energy crops such as Miscanthus, as well as trees.

Paterson’s blanket dismissal of the potential for biomass production to reduce CO2 emissions is therefore not scientifically defensible. Sustainable biomass energy production is entirely possible, already providing (for example) nearly a third of Sweden’s electricity today. It could represent an important contribution to decarbonized energy production in the UK and elsewhere.

(2) It might seem to be common sense that planting trees (and never cutting them down) would bring greater benefits in extracting CO2 from the atmosphere than planting trees for harvest and combustion. All the same, it is wrong. The point is that just planting trees produces no energy, whereas planting trees for biomass energy production provides a substitute for the use of fossil fuels. There is an enormous difference. Indeed, it has been known for a long time that the total reduction in atmospheric CO2 concentration that could be achieved under an absurdly optimistic scenario (converting all the land that people have ever deforested back into forests) would reduce atmospheric CO2 concentration by a trivial amount, relative to projected increases due to burning fossil fuel (House et al., 2002; Mackey et al. 2013).

I thank Jeremy Woods (Imperial College) and Jonathan Scurlock (National Farmers Union) for their helpful advice on this topic, and suggestions to improve the text.


  References

Haberl, H. et al. (2012) Correcting a fundamental error in greenhouse gas accounting related to bioenergy. Energy Policy 45: 18-23.

House, J.I., I.C. Prentice and C. Le Quéré (2002). Maximum impacts of future reforestation or deforestation on atmospheric CO2. Global Change Biology 8: 1047-1052.

Mackey, B. et al. (2013) Untangling the confusion around land carbon science and climate change mitigation policy. Nature Climate Change 3: 552-557.

RSPB, Friends of the Earth and Greenpeace (2012) Dirtier than coal? Why Government plans to subsidise burning trees are bad news for the planet. http://www.rspb.org.uk/Images/biomass_report_tcm9-326672.pdf

Searchinger, T. et al. (2009) Fixing a critical climate accounting error. Science 326: 527-528.


Has climate change been exaggerated? Fact-checking Owen Paterson’s comments

By Dr Flora WhitmarshGrantham Institute

tropical storm 250In a lecture to the Global Warming Policy Foundation, the former UK Environment Secretary Owen Paterson has criticised the current government’s climate and energy policies, suggesting there is too much emphasis on renewables and that the consequences of climate change have been exaggerated. A discussion of Mr Paterson’s comments on UK energy policy appears in another Grantham blog by Dr Simon Buckle. Here I will discuss one of the reasons for Paterson’s position, the belief that climate change has been exaggerated.

Paterson suggested that the Earth has not warmed as much as had been predicted, “ … I also accept the unambiguous failure of the atmosphere to warm anything like as fast as predicted by the vast majority of climate models over the past 35 years, when measured by both satellites and surface thermometers. And indeed the failure of the atmosphere to warm at all over the past 18 years – according to some sources. Many policymakers have still to catch up with the facts.”

If we look back to earlier attempts to quantify global warming, it is now becoming clear that while these attempts were not perfect, they were not hugely inaccurate either. Natural climate variation is more significant than global warming over shorter time periods, but about 25 years have now passed since the earliest attempts to produce policy-relevant projections of rate of warming, and subsequent publications have started to assess how accurate these projections were.

Early climate projections

In late 2013, the Intergovernmental Panel on Climate Change (IPCC), a body reporting to the UN, released the first volume of its Fifth Assessment Report. This volume contained an in-depth summary of scientific knowledge about climate science. Scientific understanding of the climate has come a long way since the IPCC released their First Assessment Report in 1990, but the basics of the greenhouse effect were well understood at the time. The projections of future temperature rise in the 1990 report represent the earliest attempt to produce a scientific consensus of opinion regarding the severity of global warming.

A paper published in 2010 by Frame and Stone checked the projections in the First IPCC Report against observed temperature rise.  Under the “business as usual” emissions scenario, the IPCC’s best estimate for the projected temperature increase between 1990 and 2010 was 0.55C, within a range of uncertainty. According to two different data sets, temperatures actually increased by 0.35C (HadCRUT3) or 0.39C (GISTEMP) during that period. This is just outside the broader range given by the IPCC, but the IPCC’s range was intended to reflect the uncertainty in the effects of greenhouse gases emissions on the long term warming trend. No attempt was made to include natural climate variability. Frame and Stone performed calculations to account for natural variability using two plausible methods. Both methods showed that the measured temperature increase is consistent with the IPCC’s projections when natural variability is taken into account. In addition, emissions have not been precisely the same as the trajectory used by IPCC, although on this timescale the difference is probably not very significant.

Another early attempt to make policy-relevant projections was published by Hansen et al. in 1988, and results from this work were presented in testimony to the US congress in the same year. Analysis published in 2006 by Hansen et al. demonstrated that the 1988 calculations had been remarkably accurate, with the observed temperatures closely matching those projected under the most realistic emissions scenario. The exceptionally close agreement between the model projections and the observations may have been coincidental since the sensitivity of the climate to carbon dioxide in Hansen’s original model was near the top of the currently accepted range. Nevertheless, the temperature increases projected by the model were close to observations available in 2006.

It is reassuring that these early projections have proved to be of the right magnitude even though the exact rate of warming wasn’t projected. It is worth bearing in mind that the original projections were made about 25 years ago, and the subsequent analysis referenced here was carried out in 2006 and 2010, meaning that only 18-20 years of data is used. This is still not long enough to iron out the full effects of natural variability. Nevertheless, it is now clear that the planet is warming and that humans are responsible, something that could not be concluded unequivocally from the evidence available 25 years ago. It is testament to this overwhelming evidence that those opposed to action on climate change now rely on relatively minor criticisms of climate science to form the basis of their opposition.

Coming to Paterson’s second point, it is indeed true that there has been no significant increase in global surface temperatures in the 21st century so far. However, global warming is not expected to lead to a linear increase in surface temperatures. Indeed, the First Assessment Report of the IPCC, published in 1990, stated that “The [average global surface temperature] rise will not be steady because of the influence of other factors.” Other factors – notably solar cycles, volcanic eruptions and natural climate variation – are known to affect global surface temperatures. The lack of surface temperature increase this century is due to a combination of factors, but almost certainly there has been some contribution from natural changes in the amount of heat taken up by the ocean. It is important to note that the overall heat content of the planet continues to increase and this is still contributing to sea level rise and ice melt.

The impacts of climate change

Paterson continued, “I also note that the forecast effects of climate change have been consistently and widely exaggerated thus far.

“The stopping of the Gulf Stream, the worsening of hurricanes, the retreat of Antarctic sea ice, the increase of malaria, the claim by UNEP that we would see 50m climate refugees before now – these were all predictions that proved wrong.”

There is a hierarchy of uncertainty in climate change prediction. The increase in surface temperatures at a global level due to the greenhouse effect is well understood scientifically. The total amount of heat in the earth system is increasing due to greenhouse gas emissions, which is having the effect of melting ice and snow and warming the ocean, lower atmosphere and Earth surface. All of these impacts, along with ocean acidification from increasing atmospheric carbon dioxide concentrations, are almost certain to continue. Increasing temperatures will also have more complex dynamic effects, including on ocean currents and atmospheric circulation – key aspects of climate variability – as well as on weather patterns, including extreme weather. These impacts are generally harder to predict because there are more factors involved. Putting all of this together and trying to predict the effect of climate change on humans or ecosystems is even more complicated.

The large scale Atlantic Ocean circulation, of which the Gulf Stream forms a part, is driven in part by processes in the North Atlantic that depend on the density of the water in the region.  Polar ice melt and changing rainfall patterns due to climate change both have the effect of depositing relatively fresh (and therefore low density) water in the North Atlantic, meaning this process could be affected by climate change. The possibility of a complete shutdown of this North Atlantic circulation has been discussed based on the results of simplified models that show this as a possible outcome.  However, mainstream scientific consensus has never been that that this is likely. Again, it is worth going back to older IPCC reports, which form the most comprehensive overview of the scientific understanding of climate change at the time they were written. At the time of the IPCC’s Second Assessment Report in 1995, the available models suggested that the ocean overturning circulation would weaken due to climate change. Subsequent reports in 2001 and 2007 also projected a slowdown and discussed the possibility of a shutdown, but neither report predicted a complete shutdown before 2100. By the time of the latest IPCC report in 2013, the overturning circulation was projected to weaken by between 11% and 34% by 2100. A slowdown has not yet been detected in the observations; this is likely due to the significant natural variability in the strength of the overturning circulation and the limited observational record.

There is more than one way that climate change can affect hurricanes (or tropical cyclones more generally). Heavy rain is almost certainly becoming more frequent and intense globally, and this includes rain that falls during tropical cyclones. In addition there could be an effect on wind speeds or on the frequency of tropical cyclones. The IPCC’s Fifth Assessment Report reported observational evidence that the strongest tropical cyclones in the North Atlantic have become more intense and more frequent since the 1970s, although there is no evidence of a global trend.

There has been a global decline in ice and snow due to climate change. Taking sea ice specifically, Arctic and Antarctic Sea Ice have different characteristics. The Arctic sea ice is more long lived and is declining in both area and mass. Antarctic sea ice is not declining in area because the ice is more mobile than in the Arctic meaning its characteristics are more complex. However since its thickness has not been accurately measured, it is not known whether it has gained or lost mass overall. Sea ice is not to be confused with the Greenland and Antarctic ice sheets, both of which are losing mass. This is discussed in more detail in a previous blog.

Coming back to the hierarchy of uncertainty, changes in malaria incidence and the numbers of potential climate refugees are in the most uncertain group of impacts. These changes depend on the detailed changes in climate in the location under discussion and the response of humans or mosquitos/malarial parasites to that. A change in malaria incidence is still possible, but this remains the subject of research. As well as local climate conditions, the number of climate change refugees would also depend on the response from local people, governments or other organisations in adapting to the effects of climate change. The number of unknowns here makes it very difficult to predict how many people might be displaced by climate change, but this does not undermine our confidence in climate science itself.


Paterson misses the point

By Dr Simon Buckle,  Grantham Institute

smoking chimneysOwen Paterson’s remarks on the UK response to climate change miss the point.  I do not disagree with him that the UK decarbonisation strategy should be improved.  In particular, there is a need for a more effective strategy on energy demand.  However, my preferred policy and technology mix would be very different to his and include the acceleration and expansion of the CCS commercial demonstration programme in order to reduce the energy penalty and overall costs of CCS. And without CCS, there is no way responsibly to use the shale gas he wants the UK to produce in the coming decades for electricity generation or in industrial processes, or any other fossil fuels.

However, these are second order issues compared to his call for scrapping the 2050 targets and the suspension of the UK Climate Change Committee.  On current trends, by the end of the century, the surface temperature of our planet is as likely as not to have increased by 4°C relative to pre-industrial conditions.  The present pause in the rise of the global mean surface temperature does not mean we do not need to be concerned.   We are fundamentally changing the climate system, raising the likelihood of severe, pervasive, and irreversible impacts on society and the natural systems on which we all depend.

A cost-effective policy to limit these very real climate risks must be based on concerted, co-ordinated and broad-based mitigation action.  This is needed to deliver a substantial and sustained reduction in global greenhouse gas emissions, which continue on a sharply rising trajectory.  The best way to create the conditions for such action by all the major emitting economies – developed and developing, in different measure – is through the UN negotiation process, supplemented by bodies such as (but not confined to) the Major Economies Forum.  The focus of this process is now on achieving a deal covering emissions beyond 2020, due to be finalised at the Paris summit at the end of next year.

There are encouraging signs of progress, e.g. in both the US and China, and the EU is due to agree its own 2030 targets at the end of this month.  But the process is difficult and protracted.  I agree with Paterson that 2050 is not the be all and end all.  I have argued here that the Paris talks should focus on how the next climate agreement can help us collectively to achieve a global peak in emissions before 2030, the first necessary step to any stringent mitigation target, rather than trying to negotiate a deal covering the whole period to 2050.

If Paris is a success, we might then re-assess whether or not the UK’s current mitigation targets are adequate or not.  But we are rapidly running out of time to achieve what the world’s governments profess to be their aim of limiting global warming to at most 2 degrees Celsius above pre-industrial levels.  The longer we delay mitigation action, the more difficult that challenge will be and the more expensive.  At some point soon it will become impossible in practical terms.

Given its leadership on this issue over many decades, UK action to scrap the Climate Change Act and/or suspend or abolish the Climate Change Committee would be severely damaging.  Seeking short-term domestic political advantage – which is what this move appears to be – through recommendations that would undermine national, European and international efforts to limit climate risks is irresponsible.   Sadly, this seems to be what the so-called political “debate” in the UK has been reduced to.

2°C or not 2°C – should we ditch the below 2°C target for global warming?

By Professor Joanna Haigh, Co-Director, Grantham Institute

Thermometer250A commentary published in Nature this week has opened up a discussion about the value of using the goal of keeping global warming to below 2°C.

David Victor and Charles Kennel are concerned that the below 2°C target for global warming is not useful, partly because they consider it is no longer achievable and partly because global mean surface temperature does not present a full picture of climate change.  The problem comes, of course, in identifying an alternative approach to establishing what is required from attempts to mitigate global warming.

The 2 degree target is in a sense nominal, in that it there is no precise threshold at which everything goes from bearable to unbearable, but it does have the advantage of being easy to understand, for both policy makers and the wider public . The proposed alternative indicators, including ocean heat content and high latitude temperature, have scientific validity but the implications of changes in these parameters may not be obvious to people living away from these areas. Furthermore, monitoring any measure on a real time basis will not avoid the intrinsic variability seen in the global temperature record. Ocean heat content shows an apparently unremitting upward trend at present but a climate change denialist would have been happy to point out a “hiatus” in that trend during the 1960s.

Victor and Kennel also state that “the 2°C target has allowed politicians to pretend that they are organizing for action when, in fact, most have done little”. This criticism would apply to any target – providing it is still at such sufficient distance to remain broadly plausible – and their proposal for “a global goal for average [greenhouse gas] concentrations in 2030 or 2050” would provide equal opportunity for prevarication.

According to a review of recent emissions reduction modelling studies conducted for the AVOID 2 programme co-authored by Ajay Gambhir of the Grantham Institute, it is still possible to meet the 2 degrees C target, provided that a broad portfolio of technologies is available and that there are no significant delays in global coordinated mitigation action. A continuation of relatively weak policies to 2030, or the absence of specific technologies such as carbon capture and storage, could however greatly increase mitigation costs and in some models render the target unachievable.

Nevertheless, Victor and Kennel are right to point out the problems with the current over-simplistic approach and I hope that their initiation of a search for “indicators of planetary health” will spur someone to invent a useful new measure for monitoring and assessing climate change.


Read more about Grantham Institute research on climate mitigation

Reflections on the UN Climate Summit in New York

By Dr Simon Buckle,  Grantham Institute

“Once more unto the breach, dear friends, once more”

New YorkClimate change was not, so far as I know, one of the issues that Shakespeare wrote about, despite plays like “The Tempest” or (for the sceptically minded) “Much Ado about Nothing”.  But King Henry V’s lines in Act III of the play of that name could have been written for the UN Secretary General to deliver at the Climate Summit in New York on 23 September where, with the help of a VIP cast, he in effect also urged us to “stiffen the sinews” to address one of the defining issues of our age.  And he was right to do so.

Without concerted and sustained action to reduce greenhouse gas emissions from the major emitting economies and across various sectors, climate risks will continue to grow to potentially catastrophic levels.  Thirteen of the 14 warmest years on record have occurred during the 21st Century. Atmospheric concentrations of carbon dioxide are growing rapidly.  And on current trends, the average surface temperature of the planet is likely to be some 4 degrees Celsius warmer by the end of the century.

There is increasing evidence that action on climate change is compatible with continued economic growth and development. Indeed, one could argue that it is a prerequisite.  The recent Calderon report illustrates that in many cases action makes sense even in narrow economic terms and highlights the opportunities for action on cities, land use and energy.  While undoubtedly there will be losers as well as winners from a transition to a low-carbon economy, this fact has always been true of the major economic and social transformations that have shaped our world.

The point is that, unless we act, there is a real risk that humankind will face a far worse future than its recent past.  Financial investors see these risks – that’s why global investors representing US$24 trillion of assets have just called on “governments to develop an ambitious global agreement on climate change by the end of 2015. This would give investors the confidence to support and accelerate the investments in low carbon technologies, in energy efficiency and in climate change adaptation.”

I must admit, the analogy with Henry V is not perfect for (at least) two reasons.  First, the venue for the 2015 climate summit that is meant to finalise this new global agreement is Paris. Some six hundred years after the famous battle at Agincourt, I hope preparations for the summit will be marked by excellent co-operation between the UK and France, at all levels!

Second, an all out fight between the developed and the developing world must be avoided.  Clearly, whatever agreement is reached in Paris will have to address the diversity of nations and developing country concerns about finance and technology.  But the scale of the problem is now such that there can be no rigid divide between the developed and the developing worlds.  We will all have to work together if we are to achieve the peak in global emissions in the next ten to fifteen years or so, which is the first necessary step in reducing climate risks.

An international agreement between governments on its own will not be sufficient however.  Action needs to be taken at all levels – city, sub-national, national and regional – and across sectors.  To quote from the Calderon report, this will only happen if governments provide “consistent, credible, long-term policy signals”.  Well-designed policies can drive resource efficiency, create the conditions for investments in low-carbon, resilient infrastructure and stimulate innovation in the technologies we need and the new business models and social practices that will drive this generational transformation to a low-carbon world.

“Once more unto the breach, dear friends, once more”…

Feasibility and affordability of reducing greenhouse gas emissions

By Ajay Gambhir, Research fellow on mitigation policy at the Grantham Institute

wind turbines300
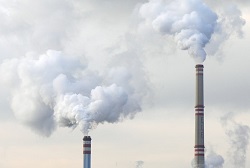
The United Nations Climate Summit 2014, to be held in New York on 23rd September, comes at an important point in the calendar for discussions on how to address climate change. Next year will see nations submit pledges on their future greenhouse gas emissions levels, as part of the United Nations process culminating in the 21st Conference of the Parties (COP) in Paris at the end of 2015, the ambition of which is to secure a global agreement to tackle climate change.

There is now a rich body of evidence on the implications of mitigation at the global, regional and national levels. This note presents some of the evidence, revealed by research in the Grantham Institute over recent years, which supports the view that mitigation remains feasible and affordable.

Technologies and costs of a global low-carbon pathway

The Grantham Institute, in partnership with Imperial College’s Energy Futures Laboratory (EFL) demonstrated a relatively simple, transparent analysis of the relative costs of a low-carbon versus carbon-intensive global energy system in 2050. The report concluded that mitigation in line with a 2 degrees Celsius limit to global warming would cost less than 1% of global GDP by 2050 (excluding any potentially significant co-benefits from improved air quality and enhanced energy security).

Joint Grantham and EFL report: Halving global CO2 by 2050: Technologies and Costs

The importance of India and China

The two most populous nations, India and China, have undergone rapid economic growth in recent decades, resulting in significantly increased demand for fossil fuels, with associated increases in their CO2 emissions. Mapping pathways towards a low-carbon future for both regions presents challenges in terms of technology choices, affordability and the interplay with land, water and other resources. The Grantham Institute, in partnership with other research groups (including IIASA and UCL), has produced long-term visions of both regions using energy technology modelling and detailed technology and resource assessments, to set out pathways to very low-carbon economies which can be achieved at relatively modest costs. In addition, the Institute has undertaken assessments of the feasibility and cost of achieving the regions’ near-term (2020) Cancun pledges.

Grantham Report 1: An assessment of China’s 2020 carbon intensity target

Grantham Report 2: China’s energy technologies to 2050

Grantham Report 4: An assessment of India’s 2020 carbon intensity target

Grantham Report 5: India’s CO2 emissions pathways to 2050

Key sectors and technologies

Reports have been produced on a number of key technologies across all economic sectors and on the role that these can play in a low-carbon world: electric and other low-carbon vehicles in the transport sector; low-carbon residential heating technologies; other building efficiency and low-carbon options; and a range of technologies and measures to reduce emissions from industrial manufacturing.

The successful development and deployment of a range of low-carbon power sector technologies will be central to decarbonising the power generation sector over the coming decades, thereby providing the basis for low-carbon electrification in the building, transport and industrial sectors. The Institute has produced briefing papers on the technological status, economics and policies to promote solar photovoltaics and carbon capture and storage (including with bioenergy to produce net negative emissions).

Grantham briefing paper 2: Road transport technology and climate change mitigation

Grantham briefing paper 3: Carbon capture technology: future fossil fuel use and mitigating climate change

Grantham briefing paper 4: Carbon dioxide storage

Grantham briefing paper 6: Low carbon residential heating

Grantham briefing paper 7: Reducing CO2 emissions from heavy industry: a review of technologies and considerations for policy makers

Grantham briefing paper 8: Negative emissions technologies

Grantham briefing paper 10: Shale gas and climate change

Grantham briefing paper 11: Solar Power for CO2 mitigation

Grantham Report 3: Reduction of carbon dioxide emissions in the global building sector to 2050

Competitiveness

A critical consideration in any nation or region’s mitigation strategy is the degree to which a low-carbon transition might put its industries at risk of losing competitiveness against rivals in regions with less stringent mitigation action. In a landmark study using responses from hundreds of manufacturing industries across the European Union, researchers at the Institute, in partnership with the Imperial College Business School and Universidad Carlos III de Madrid, have produced robust evidence to support the contention that the EU’s Emissions Trading System has not produced any significant competitiveness impacts or industry relocation risks.

On the empirical content of carbon leakage criteria in the EU Emissions Trading Scheme – Ecological Economics (2014)

Industry Compensation under Relocation Risk: A Firm-Level Analysis of the EU Emissions Trading Scheme – American Economic Review (2014)

Global energy governance reform

The energy policies of governments around the world will, to a large extent, determine global greenhouse gas emissions.   Western governments cooperate on their energy policies through the International Energy Agency (IEA), which is a powerful advocate and analyst of low carbon energy strategies.  Unfortunately the IEA excludes developing nations, such as China, India, Brazil, Indonesia, from its membership.  The Grantham Institute is working with China’s Energy research Institute (ERI) to advise the Chinese government on China’s options for greater engagement in international energy cooperation, including closer association with the IEA.   China’s participation is important for world energy security and affordability – the other main objectives of energy policy –   as well as for climate mitigation.   A consultation draft report published by this ERI/Grantham project is at Global energy governance reform and China’s participation. An earlier report by the Grantham Institute with Chatham House is at Global energy governance reform.

Ocean heat uptake – checking the facts

The Climate and Environment at Imperial blog has moved. View this post on our new blog 

By Dr Flora Whitmarsh, Grantham Institute

The recent slowdown in global temperature rise has led to suggestions that global warming has stopped. In fact, the Earth system is still gaining heat, and the slowdown was likely caused by a series of small volcanic eruptions, a downward trend in the solar cycle, and increased heat uptake of the ocean. Writing in the Telegraph, Christopher Booker claims that a new paper by Professor Carl Wunsch (Wunsch, 2014) shows that ocean warming cannot explain the slowdown because the deeper ocean is in fact cooling rather than warming. Booker is incorrect in his interpretation of the paper, as Professor Wunsch explained in a letter of response to the Telegraph editor that was not published. Wunsch also wrote a letter to the editor of The Australian following a similarly misleading article in that newspaper. There are two threads to Christopher Booker’s argument in the Telegraph article. First, he suggests that the new paper refutes the idea that the pause is caused by an increase in ocean heat uptake, an interpretation that is untrue. Second, Booker gives a misleading interpretation of Wunsch’s appearance on the 2007 television documentary The Great Global warming Swindle in which Wunsch’s views were misrepresented by the documentary makers. Below, I describe the significance of ocean heat uptake and then discuss Booker’s two points in turn.

Figure 1
Figure 1: the amount of heat taken up by the upper ocean (above 700 m), deep ocean (below 700 m), atmosphere and earth, and the amount going into melting ice (IPCC, 2013).

   The significance of ocean heat uptake

The ocean is an important heat sink and has taken up over 90% of the extra heat absorbed by the Earth system over the last century. There is natural variation in the amount of heat being taken up by the ocean. This is part of the reason why the observed increase in surface temperatures has not been uniform in the past. All studies including this latest one agree that the ocean above 2000 m is absorbing a significant amount of heat and this is the main focus of studies trying to detect and attribute global warming. The study of the ocean below 2000m is interesting from a scientific point of view but is less relevant to the study of climate change because it takes a very long time for heat to mix to these lower layers. Heat is transferred to the deep ocean by the movement of water masses – the mixing driven by the small-scale movement of water molecules is too slow to be of much significance. Due to the locations of the major ocean currents, parts of the deep ocean such as the western Atlantic and the Southern Ocean in the Antarctic have been in contact with the surface relatively recently, meaning they would be expected to have warmed due to global warming. By contrast, much of the Pacific Ocean below 1500 m has not been in contact with the surface for around a thousand years – something that has been demonstrated by studying the radioactive decay of carbon-14 atoms  in a technique similar to the carbon dating of objects (Matsumoto, 2007 – see figure 2).

Figure 2
Figure 2: The circulation carbon-14 age of ocean water below 1500 m (Matsumoto, 2007). Much of the water in the deep Pacific Ocean has not been in contact with the surface for around 1000 years, meaning that its temperature is unlikely to have been influenced by human activities since the industrial revolution.

       What is happening in the deep ocean?

Christopher Booker writes, “Prof Carl Wunsch … has produced a paper suggesting not only that the warmists have no real evidence to support their claim other than computer modelling, but that the deeper levels of the oceans have, if anything, not been warming but cooling recently, thanks to climate changes dating back centuries.”

Figure 3
Figure 3: Change in ocean heat content between 1993 and 2011 below 2000 m depth, in units of 108 Joules. There has been heating at this level in the Western Atlantic and Southern Ocean and cooling elsewhere.

In the paper under discussion, Bidecadal Thermal Changes in the Abyssal Ocean, Wunsch looks at observations of ocean heat content. He found that the ocean as a whole and the top 700 m had gained heat since 1993, but that there had been an overall decline in heat content below 2000 m according to the available data. There has been a warming in the regions of the deep ocean below 2000 m where it would be expected due to the transport of water from the surface to the abyss by major ocean currents, i.e. the western Atlantic Ocean and the Southern Ocean (see figure 3). There was an observed cooling below 2000 m in other parts of the ocean including most of the Pacific. Much of the deep Pacific Ocean would not be expected to have warmed due to climate change because the water has not been in recent contact with the surface (figure 2). The available observations are very sparse and only about a third of the water below 2000 m was sampled at all during the period under discussion, meaning it is not known whether these results reflect a genuine cooling below 2000 m. Because there was heating in some places and cooling in others, it is particularly hard to accurately determine the mean from very sparse observations. The main conclusion of Wunsch, 2014 was in fact that more observations are needed to improve our understanding of processes involved in transporting water to the deep ocean. This is a subject which has received relatively little attention, with much more research effort being concentrated on the upper ocean. It is likely that this is partially due to the difficulty involved in observing the ocean at depth, and partly because the upper ocean is of interest due to its direct impact on weather patterns, for example through its role in the formation of El Niño and La Niña conditions. None of this changes the fact that the Earth system as whole is gaining heat, and that a significant proportion of that heat is being taken up by the ocean, mostly in the top 700 m. The paper doesn’t significantly change our understanding of the pause in surface temperature rise. We know that natural processes do change the amount of heat taken up by the ocean over time, and that surface temperature rise has not been uniform in the past. However, precisely quantifying how much heat has been taken up by the deep ocean is still not possible with current observations.


      The Great Global Warming Swindle

Referring to the 2007 television documentary, The Great Global Warming Swindle, Booker suggested that Wunsch had privately held “sceptic” views at the time the programme was aired, but didn’t feel able to express these views in public, “So anxious is the professor not to be seen as a “climate sceptic” that, [after being interviewed for] The Great Global Warming Swindle, he complained to Ofcom that, although he had said all those things he was shown as saying, he hadn’t been told that the programme would be dedicated to explaining the scientific case against global warming.” Professor Wunsch’s views on The Great Global Warming Swindle are explained at length on his professional webpage in an article dated March 2007. I will not paraphrase his comments in detail, but suffice it to say he states his belief that “climate change is real, a major threat, and almost surely has a major human-induced component”, and wrote to the documentary makers to say, “I am the one who was swindled” because they misrepresented his views by quoting him out of context. In an update written three months later, Wunsch made it clear that he did not complain to Ofcom under duress from other scientists. In fact, he felt so strongly that his opinions had been misrepresented that he filed his complaint despite threats by the documentary maker to sue him for libel. References Matsumoto, K. (2007), Radiocarbon-based circulation age of the world oceans, J. Geophys. Res., 112, C09004. Wunsch, 2014: Carl Wunsch and Patrick Heimbach, 2014: Bidecadal Thermal Changes in the Abyssal Ocean. J. Phys. Oceanogr.44, 2013–2030.

Ocean warming in the media

A recent paper on ocean warming has been reported on in a number of newspaper articles, most recently by Christopher Booker in the Sunday Telegraph.

The author of the paper, Professor Carl Wunsch of MIT, wrote a letter to the editor of the Sunday Telegraph in response to Christopher Booker’s article. As the letter has yet to be published in the Sunday Telegraph, with the permission of Professor Wunsch we have decided to post it here.

Dear Editor,

In the Sunday Telegraph of 27 July 2014, Christopher Booker pretends to understand a highly technical paper on ocean warming to such a degree that he can explain it to his lay-audience. Had he made the slightest effort to contact me, I could have told him that the paper in reality says that the ocean is warming overall at a rate consistent with previous values – but that parts of the deepest ocean appear to be cooling. This inference is not a contradiction to overall warming. He imputes to me a wish to hide my views: nothing could be further from the truth. I believe that global warming is an extremely serious threat, but how that threat will play out in detail is scientifically still poorly understood. Anyone who interprets the complexity of change to mean global warming is not occurring and is not worrying, is ignorant enough to regard The Great Global Warming Swindle as a documentary – it is an egregious propaganda piece.

Carl Wunsch

Harvard University and Massachusetts Institute of Technology

Grantham Institute welcomes results of Energy and Climate Change Committee review of IPCC WG1 report

Uk ParliamentThe House of Commons Energy and Climate Change Committee report on the Working Group 1 contribution to the IPCC Fifth Assessment Report, which is published today, has found the IPCC process to be robust. The committee launched an inquiry into the IPCC WG1 report in October 2013, following criticism by some commentators of the IPCC review process and its conclusions.

The Grantham Institute submitted written evidence to the committee (you can read our evidence here) and our Chair Professor Sir Brian Hoskins was called before the committee to give oral evidence.

The committee found that “the IPCC has responded extremely well to constructive criticism in the last few years and has tightened its review processes to make its Fifth Assessment Report (AR5) the most exhaustive and heavily scrutinised Assessment Report to-date. The MPs call on the IPCC to continue to improve its transparency, however. The IPCC would benefit, they say, from recruiting a small team of non-climate scientists to observe the review process and the plenary meetings where the Summary for Policymakers is agreed.”


Commenting on the report Professor Joanna Haigh, Co-Director Grantham Institute said:

“Having assessed a significant quantity of submitted evidence, both written and oral, this report is overwhelmingly supportive of both the procedures and the conclusions of the IPCC. It concludes that the WG1 report is the best available summary of the state of the science of climate change, that improvements to IPCC procedures since the Fourth Assessment have ensured “the highest Quality of scholarship” and that there is no scientific basis for downgrading UK’s ambition to reduce greenhouse gas emissions.

In terms of procedures it recommends two areas of further improvement – the appointment by governments of some non-climate scientists as members of the Executive Committee, and to observe the review process, and a greater level of transparency in plenary meetings discussing the Summary for Policymakers – but these recommendations in no way reflect concern about the content of the Assessment. A whole chapter of the report is devoted to examining criticisms that have been levelled, from both inside and outside the scientific community, on the scientific conclusions but none is found to have significant bearing.

Such a robust report from an all party parliamentary committee surely means that we can now reduce efforts spent on dealing with the constituencies working to discredit the IPCC, concentrate on understanding the science behind climate and climate change and do our best to make sure that the government plays a leading role in achieving a global deal on climate change.”


Professor Sir Brian Hoskins, Chair of the Grantham Institute said:

“The committee recognises that the recent WG1 report of IPCC gives a very good summary of the science relevant to climate change, whilst there are some remaining issues on transparency.

The question now is how do we respond to the risk posed by climate change, and I am pleased to see that the Report is clear: it supports the basis for the advice given by the Climate Change Committee and the path the UK is taking towards its 2050 carbon reduction target, in particular the 4th Carbon budget recently confirmed by Government, it advises that the UK Government at the top level should play a major role in international discussions leading up to Paris 2015.”


Sticking to the budget

Carbon budgetFollowing on from Simon Buckle’s post this morning another piece of good news on emissions reductions, the UK government has announced that they will not amend the fourth carbon budget, after reviewing their commitments in light of progress within the EU.

Therefore the carbon budget for 2023-27 remains at 1,950 MtCO2e, keeping the UK on track to reduce greenhouse gas emissions by 2050 by 80% relative to 1990 levels.

This decision is in line with advice from the Committee on Climate Change given in December 2013, that there was no basis to change the fourth carbon budget.

You can read more about the review in our background note on the fourth carbon budget.

Merkel raises the level of ambition

By Dr Simon BuckleGrantham Institute

Brandenburg gateThere was some good news last week from the annual Petersberg Climate Dialogues held on 14-15 July in Berlin.  The Petersberg meetings were instituted after the perceived failure of the Copenhagen summit in 2009 in order to support the UNFCCC talks. They are co-chaired by Germany and the country hosting the next Conference of the Parties meeting, in this case Peru.

Chancellor Merkel took the opportunity in her address to signal renewed ambition for climate action, perhaps disappointing some of those who had been hoping (or even working) for a reversal of Germany’s commitment to decarbonisation.  As reported by EurActiv, Merkel said that “A turnaround is needed – worldwide“.  Making it clear that she intends to re-energise climate change mitigation, she noted that Germany aims to cut its own CO2 emissions by 40% by 2020 (relative to 1990 levels) and that “Europe will be making an “ambitious contribution” to the forthcoming UNFCCC negotiations that should result in a new climate agreement at the Paris conference in 2015.  Of course, the current European Commission proposal to be discussed in October is somewhat less ambitious, reflecting largely East European concerns, and proposes a 40% reduction of EU-wide emissions only by 2030.

The final statement by the German and Peruvian co-Chairs repeated the point I have been making over the past few months to a number of national climate negotiators and the UNFCCC Secretariat and which was the subject of my 3 July blog. This is that “there was a need for [national] contributions in aggregate to meet the overall ambition of maintaining temperature increase below 2°C.  In order to ensure this happens, some Ministers acknowledged that a process for collectively considering intended nationally determined contributions was necessary.”  Progress, if not yet complete agreement.

The sense of greater momentum was reinforced by the announcement by the Vice President of the Chinese National Development and Reform Commission, Xie Zhenhua, that as part of its contribution to the Paris agreement, it may set a date for the peaking of its own emissions.

Just a couple of months before the UN Secretary General’s climate summit on 23 September, the political climate looks a lot brighter than it has for a long while.  Achieving what I see as the first and most significant step on the global mitigation pathway – a peak in global fossil-related carbon dioxide emissions, ideally before 2030 – is the sort of inspirational but realistic target that leaders should now embrace for the Paris agreement if we are to make the most of this opening window of opportunity to limit future climate risks.

Fact checking a recent Telegraph article by Christopher Booker

by Dr Flora WhitmarshGrantham Institute

newspaperIn an article for the Telegraph, Christopher Booker gave his views on Professor Sir Brian Hoskins’ appearance on the Today programme earlier this year. In the article, Booker made several claims about climate science relating to rainfall, atmospheric humidity, polar sea ice extent, global temperatures and sea level rise. In this blog I will assess his claims against the findings of the latest report of Working Group 1 of the Intergovernmental Panel on Climate Change (IPCC), a hugely comprehensive assessment of the scientific literature.

  Rainfall and floods

Booker’s comment: “Not even the latest technical report from the UN’s Intergovernmental Panel on Climate Change (IPCC) could find any evidence that rainfall and floods were increasing.”

 Scientific Evidence:

The IPCC report found a significant climate influence on global scale changes in precipitation patterns (with medium confidence), including increases in precipitation in northern hemisphere mid to high latitudes. Further evidence of this comes from the observed changes in sea level salinity, an indication of the global distribution of evaporation and precipitation. The data is currently too inconclusive to report other regional changes in rainfall with confidence. Overall, however, there had been little change in land-based precipitation since 1900, contrasting with their 2007 assessment, which reported that global precipitation averaged over land areas had increased.

The IPCC concluded that there continues to be a lack of evidence and thus low confidence regarding the sign of trend in the magnitude and/or frequency of floods on a global scale.

The IPCC’s projected short-term changes (2016-35) in rainfall were:

  • Increased mean precipitation in the high and some of the mid latitudes (very likely)
  • Reductions in the sub-tropics (more likely than not).

There is also likely to be an increase in the frequency and intensity of heavy precipitation events over land. Regional changes will be strongly affected by natural variability and will also depend on future aerosol level (emissions and volcanic) and land use change.

Global rainfall totals are expected to go up in the longer term (i.e. beyond 2035) by around 1-3% per degree Celsius of global mean surface temperature increase, except in the very lowest emissions scenario.

Booker is partially right on past changes: the IPCC found no significant trend in global average rainfall over land. But this is not to say there has been no effect. Indeed, the expected increase in extreme heavy rain is already happening: the IPCC concluded with medium confidence that since 1951 there has been an increase in the number of heavy precipitation events in more regions than have had a decrease.

Read more about the impacts of climate change on UK weather

Atmospheric humidity

Booker’s comment: “From the official National Oceanic and Atmospheric Administration (NOAA) satellite data on humidity (shown on the “atmosphere page” of the science blog Watts Up With That), we see it has actually been falling.”

 Scientific Evidence:

The key measure of whether atmospheric humidity is rising or falling is specific humidity, i.e. the mass of water vapour in a unit mass of moist air.  The “atmosphere page” of “Watts Up With That” when accessed on 17 July wrongly shows data on relative humidity under the heading “Specific humidity”. Relative humidity is a measure that depends on temperature and does not therefore measure the absolute water vapour content of the atmosphere. In other words, Booker’s evidence is not evidence.

The latest IPCC report concludes that it is very likely that global near surface and tropospheric air specific humidity have increased since the 1970s.  However, during recent years the near-surface moistening trend over land has abated (medium confidence).  The magnitude of the observed global change in water vapour of about 3.5% in the past 40 years is consistent with the observed temperature change of about 0.5°C during the same period.  The water vapour change can be attributed to human influence with medium confidence.

Polar ice melt

Booker’s comment: “As for polar ice, put the Arctic and the Antarctic together and there has lately been more sea ice than at any time since records began (see the Cryosphere Today website).”

 Scientific Evidence:

The IPCC found that since 1979, annual Arctic sea ice extent has declined by 0.45-0.51 million km2 per decade and annual Antarctic sea ice extent has increased by 0.13-0.20 million km2 per decade. Taking the two IPCC estimates together, it can be inferred that total global sea ice extent has declined since 1979.

Sea ice thickness is harder to measure. The IPCC combined submarine-based measurements with satellite altimetry, concluding that Arctic sea ice has thinned by 1.3 – 2.3 m between 1980 and 2008. There is insufficient data to estimate any change in Antarctic sea ice thickness.

The reason why the Arctic sea ice has declined and the Antarctic sea ice hasn’t is because they have very different characteristics. Arctic sea ice is constrained by the North American and Eurasian landmasses to the south. In the central Arctic Ocean, the ice can survive several years, which allows it to thicken to several meters.  Due to climate warming, the Arctic summer minimum has declined by around 11.5% per decade since 1979, and the extent of the ice that has survived more than two summers has declined by around 13.5% per decade over the same period. This has serious consequences for the surface albedo (reflectance) of the Arctic, as a reduction in the highly reflecting sea ice with less reflective open water results in enhanced absorption of solar radiation.

In contrast to the Arctic, Antarctic sea ice forms in the open ocean with no northern land to constrain its formation. The vast majority of Antarctic sea ice melts each summer.

Booker mentioned sea ice specifically, but he did not mention the other important components of the global cryosphere. Making use of better observations than were available at the time of their previous report in 2007, the IPCC carried out an assessment of all the ice on the planet and concluded that there had been a continued decline in the total amount of ice on the planet. The Greenland and Antarctic ice sheets are both losing mass (with very high confidence and high confidence respectively). Glaciers are known to be declining globally (with very high confidence). Overall snow cover, freshwater ice and frozen ground (permafrost) are also declining, although the available data is mostly for the Northern hemisphere.

 Temperature

Booker says: “As for Sir Brian’s claim that by 2100 temperatures will have risen by a further ‘3-5oC’, not even the IPCC dares predict anything so scary.”

 Scientific evidence:

Future temperature rise of course depends on greenhouse gas emissions. In the lowest of the IPCC emissions scenarios, which assumes that global carbon dioxide emissions will decline after 2020, reach zero around 2080, and then continue dropping to just below zero by 2090, temperatures are projected to increase by another 0.3oC – 1.7oC by 2100. Total warming under this scenario is projected to be 0.9oC – 2.3oC relative to 1850-1900, i.e. including warming over the 20th century.  Under the highest emissions scenario, the closest to business as usual, another 2.6oC – 4.8oC of warming is projected by 2100. In this case, the total projected temperature rise by 2100 is 3.2oC – 5.4oC when past temperature rise is included.

It is worth emphasising that if emissions are not constrained then we are likely to see a temperature rise of the same order as the projections under the IPCC’s highest emissions scenario. All three of the other scenarios assume that carbon dioxide emissions will peak and then decline substantially at some point in the coming decades. If emissions continue to rise then we should expect a total temperature increase in the region of 3.2oC – 5.4oC by the end of the century. This can of course be avoided if action is taken to reduce fossil fuel dependency.

Booker says: “[Professor Hoskins] was never more wobbly than when trying to explain away why there has now been no rise in average global temperatures for 17 years, making nonsense of all those earlier IPCC computer projections that temperatures should by now be rising at 0.3C every decade.”

 Scientific evidence:


Past global surface temperature rise
Figure 1: Past global surface temperature rise according to the MLOST, HadCRUT4 and GISS datasets (IPCC, 2013). There is a long term increase in temperature, but also natural variability.

Climate change is a long term trend, and a few decades worth of data are needed to separate the warming trend from natural variability.  Global mean surface temperature increased by about 0.85oC over the period 1880-2012. Each of the last three decades has been warmer than all previous decades in the instrumental record and the decade of the 2000s has been the warmest.

The observed temperature record over the 20th Century shows periods of slower and faster warming in response to a number of factors, most notably natural variability in the climate system, the changes in atmospheric composition due to large-scale human emissions of greenhouse gases and aerosols from burning fossil fuels and land-use change, volcanic activity and small changes in the level of solar activity.

In future, there will continue to be natural variation in temperature as well as a long term warming trend due to our greenhouse gas emissions. Significant natural climate variability means that a prolonged continuation of the current slowdown in the rate of increase would not on its own be strong evidence against climate change, provided that: 1) the global mean sea level continued to rise due to thermal expansion of the oceans, the melting of glaciers and loss of ice from ice sheets, and 2) the measured net energy flow into the climate system (predominantly the ocean) remained significantly positive.

The climate models used by the IPCC are not designed to predict the exact temperature of the Earth surface in a particular year or decade. This would require scientists to predict the future state of climatic phenomena such as the El Niño Southern Oscillation or the Pacific Decadal Oscillation for a specific period several years in advance, something that is not currently possible. Volcanic eruptions also have an impact on global temperatures, and they are not known about far enough in advance to be incorporated into the IPCC’s model projections.

Read more in our Grantham Note on the slowdown in global mean surface temperature rise

The future projected increase in global surface temperature
Figure 2: The future projected increase in global surface temperature (IPCC, 2013). All the results are based on several model runs (numbers of model runs shown in the appropriate colours). The red line shows the highest emissions scenario, the closest to business as usual. The dark blue line shows the lowest emissions scenario, which assumes continued reductions in emissions after 2020, and the other two lines (orange and light blue) are intermediate scenarios.

Sea level rise

Booker says: “NOAA’s data show that the modest 200-year-long rise in sea levels has slowed to such an extent that, if its recent trend continues, by the end of the century the sea will have risen by less than seven inches.”

Scientific evidence:

Past sea level rise according to six datasets
Figure 3: Past sea level rise according to six datasets (IPCC,2013). These are based on tide gauge measurements – satellite data is included after 1993.

The IPCC assessed the relevant data carefully and concluded that sea level rose by around 19 cm (about 7 ½ inches) between 1901 and 2010. This is based on tide gauge data, with satellite data included after 1993. The rate of sea level rise was around 3.2 mm (about 1/8th inch) per year between 1993 and 2010. This is faster than the overall rate since 1901, indicating that sea level rise is accelerating as would be expected from thermal expansion of seawater and increased melting of ice on land.

Future sea level projections under the highest IPCC emissions scenario tell us what is likely to happen if emissions continue to rise unabated. In this case, sea level is projected to increase by a further 63 cm (about 24 ¾ inches) in the last two decades of this century compared with the 1986-2005 average.  Even in the lowest emissions scenario, which requires substantial emissions reductions, another 40 cm (about 15 ¾ inches) of sea level rise can be expected by 2100.


Read more in our Grantham Note on sea level rise.


Reference for figures:

IPCC, 2013: Climate Change 2013: The Physical Science Basis. Contribution of Working Group I to the Fifth Assessment Report of the Intergovernmental Panel on Climate Change [Stocker, T.F., D. Qin, G.-K. Plattner, M. Tignor, S.K. Allen, J. Boschung, A. Nauels, Y. Xia, V. Bex and P.M. Midgley (eds.)]. Cambridge University Press, Cambridge, United Kingdom and New York, NY, USA, 1535 pp.

7 Frightening Findings from the IPCC Report

By Helena Wright, Research Postgraduate, Centre for Environmental Policy

Helena Wright, an Imperial PhD student, looks at worst possible scenarios from the IPCC Working Group II report.cracked-earth

The United Nations’ Intergovernmental Panel on Climate Change (IPCC) recently released its latest report, featuring the most up-to-date science on global climate change.

As a researcher, I had an opportunity to contribute to a table in one of the chapters and have read through each of the 30 chapters of the Working Group II report (on Impacts, Adaptation, and Vulnerability).  Here is my personal take on seven of the most frightening findings from the WG2 report:

  1. CO2 levels of 1000ppm could impact on mental performance

The health chapter explains how climate change will affect global health, including direct impacts of heat stress, drought and extreme events, as well as indirect impacts on nutrition and mental health.

One extremely frightening direct effect could actually be from CO2 itself. A recent study found indoor  COlevels of 1000ppm (parts per million) can impair human decision-making performance and cognition.  Current atmospheric levels are 400ppm and rising fast.  Some scenarios have us reaching these levels by 2100. If these effects are confirmed, how will we be able to adapt?


  1. Climate stress affects children

One particularly frightening aspect of climate change is its impact on children.  This is a long term problem with implications for future generations.

Also, children, young people and the elderly are at increased risk of climate-related injury and illness. One study in Nepal found flood-related mortality was twice as high for girls as for women, and was higher for boys than men. Children are more vulnerable to impacts like malaria and diarrhoea for physiological reasons, and also more vulnerable to heat stress.


  1. Coral reefs would degrade under 2 degrees of warming

The coastal chapter explains carbonate reef structures would degrade under a scenario of 2°C by 2050-2100.  Increasing levels of  atmospheric  CO2 also cause the ocean to acidify, causing coral reefs to lose their structural integrity.  The North Atlantic and North Pacific are already becoming more acidic.

Coral reefs are important for biodiversity and account for 20-25% of fish caught in developing countries, as well as housing many other marine creatures.  Skeletal “dissolution” is expected to be widespread by 2100. The most frightening thing of all is that these are the impacts under business-as-usual scenarios.  Average global temperature has already risen by 0.8°C since 1880. Global leaders have only agreed to limit warming to 2°C of warming, a target they are currently missing.


  1. Climate extremes threaten our food security

Over 70% of agriculture is rain-fed, so agriculture and food security are highly sensitive to changes in rainfall.  Higher temperatures have an impact on crop yields.  Climate change will affect rivers and oceans as well. Some scenarios forecast widespread fish extinctions in rivers. In one study where data was available, as much as 75% of local fish biodiversity would be ‘headed toward extinction’ by 2070 due to climate change, particularly in tropical areas.

Food price rises triggered by climate shocks disproportionately affect the poor who tend to spend a higher proportion of their income on food.


  1. Global trade will be affected

Climate change will impact on international trade in both physical and value terms. For example, coffee is a major traded beverage which is sensitive to climate variability. Coffee crops will be forced to move to higher altitudes where they are available. Millions of rural people rely on coffee, tea and cocoa production.

The economic costs are expected to be huge.  For example, in Ethiopia, agricultural decline is projected to cause a 10% decline in GDP against benchmark levels.  While trade can help countries to adapt, for example by importing food, deficits may have to be met by food aid.


  1. Climate change will impact on migration, and could lead to conflict and even wars

High food prices can impact on socio-political stability.  For example, 14 countries in Africa experienced food riots in 2008 during the 2008-9 price spike.

People can also be displaced by extreme weather events. But migrants do not necessarily reach safety; with new migrants more at risk at destinations in cities. Sea level rise is projected to lead to permanent displacement as coastal areas become uninhabitable.   Under 2 metres of sea level rise, 187 million people are expected to be displaced.

Chapter 12 also examines research on links between climate change and armed conflict. Many of the factors that increase the risk of civil war are sensitive to climate change. US Military experts recently called climate change “a catalyst for conflict”.


  1. There are limits to adaptation

Finally, there are limits to adaptation.  This means we cannot adapt to many of these impacts. For example, 31 Native Alaskan villages are facing “imminent threats” due to coastal erosion and several decided to relocate – but their ability to relocate also depends on financial support.  Examples of ‘hard’ limits to adaptation include water supply in fossil aquifers, limits to retreat on islands, and loss of genetic diversity.  In such cases climate change will lead to irreversible losses.

There are various ‘tipping points’ in the earth system which, if crossed, could trigger rapid and catastrophic climate change. Only mitigation can avoid such risks.  Unfortunately little is known about where exactly these ‘thresholds’ lie, making the risks even more difficult to manage.

The limits to adaptation explain why global emission reduction is so vital for humanity.  3-4 degrees of warming would be much more difficult to adapt to than 2 degrees to and could result in the collapse of systems. Yet current climate pledges leave us heading to a world 3.7 degrees warmer.  The IPCC shows global emissions are still rising rapidly and show no signs of stabilising.  We are entering a radically different world.

However, there are reasons for hope. The UNFCCC negotiations took place again last month in Bonn, with the aim of reaching a global climate deal. There are signs of leadership from the US and China, the worlds’ two biggest emitters, offering renewed hope that collectively we can tackle this problem.