Category: Research

Stranding our fossil assets or stranding the planet

By Helena Wright, Research Postgraduate, Centre for Environmental Policy

Earlier this month Carbon Tracker came to Imperial College London to discuss their report on ‘Unburnable Carbon’.  The report outlines research which shows between 60-80% of coal, oil and gas reserves of publicly listed companies are ‘unburnable’ if the world is to have a chance of keeping global warming below the globally-agreed limit of 2°C.  The event was followed by a lively debate.

The research, led by the Grantham Research Institute at LSE and the Carbon Tracker Initiative, outlines the thesis that a ‘carbon bubble’ exists in the stock market, as companies with largely ‘unburnable’ fossil fuel reserves are being overvalued.

In fact, the OECD Secretary-General Angel Gurria recently said:

“The looming choice may be either stranding those [high carbon] assets or stranding the planet.”

Digging a hole: ever deeper extraction, ever higher risks

The report found that despite these systemic risks, companies spent $674 billion last year to find and ‘prove’ new fossil fuel reserves.  Capital expenditure has been increasing, while production has been decreasing, with reserves ever harder-to-reach.

Companies like Exxon and Shell have been spending record sums trying to prove reserves, that ultimately risk being stranded in future. The research by Carbon Tracker suggests this is a faulty business model, and in fact risks inflating the ‘carbon bubble’.

If these high levels of capital expenditure continue, we will see over $6 trillion allocated to developing fossil fuel supplies over the next decade – a huge sum of wasted capital.  Luke Sassams outlined evidence that some companies are now starting to pick up on this and rein in their CAPEX spending.

Investors and regulators are now picking up on the issue.  A Parliamentary Report on the ‘carbon bubble’ was released last week, and Chair of the House of Commons EAC, Joan Walley MP, said: “The UK Government and Bank of England must not be complacent about the risks of carbon exposure in the world economy”.

Carbon Entanglement: Getting out of the bubble

One issue that has been highlighted is the fact that some OECD governments receive rents and revenue streams from fossil fuels.  There is also a policy and credibility issue.  If businesses do not believe governments are serious about tackling climate change, they may carry on investing in fossil fuels and perpetuate the entanglement.

It seems that investors are currently backing a dying horse. But continued expenditure on finding new fossil fuel reserves might also be testament to the failures of recent climate policy.

Some have argued the ‘carbon bubble’ thesis relies on the assumption that governments will act on climate change. But arguably, there is not a question of ‘whether’ this government regulation will happen, but merely a matter of ‘when’.   There is a systemic financial risk to fossil assets, whether the necessary government regulation happens pre-emptively, or as a result of severe climatic disruption.

In the discussion that followed, the audience discussed whether the ‘carbon bubble’ will actually burst, and several participants suggested it was likely to burst unless it is deflated in a measured way. An audience member asked: “Don’t the investors have the information already?” and various participants felt they do not, demonstrating the need for enhanced disclosure on carbon risk.

Finally, the discussion turned to institutional investors who are investing in fossil fuels.  Some commentators recognise the irony.  How can a pension fund claim to be helping pensioners, while potentially risking the lives of their grandchildren?  It has also been found that several universities invest in fossil fuels, including Imperial College, sparking a recent petition. The risks of climate change highlighted in the recently released IPCC AR5 report, are driving calls for all types of investors to recognise the risks of high carbon investment.

2014 – A pivotal year for CCS?

By Dr Niall Mac Dowell, Centre for Environmental Policy

For centuries, all of the world’s economies have been underpinned by fossil fuels.  Historically, this has primarily been oil and coal, but since the mid-1980s natural gas has become increasingly important. Over the course of the last decades, there has been an increasing focus on electricity generation from renewable sources, and since about 1990 carbon capture and storage (CCS) has become an important part of the conversation around the mitigation of our greenhouse gas (GHG) emissions.

The role of CCS in addressing our GHG mitigation targets is clear and unambiguous – see for example the IEA CCS technology roadmaps which show that by 2050, almost 8 GtCO2/yr needs to be sequestered via CCS; a cumulative of 120 GtCO2 in the period from 2015 to 2050. Tellingly, this means that we need to see real action on the commercial scale deployment of CCS globally by 2015 such that we have at least 30 installations around the world actively capturing and sequestering CO2 from a range of industrial and power-generation plants. Currently, there are 8 CCS projects around the world which are actively capturing and sequestering CO2 – primarily in North America (Shute Creek, Val Verde, Enid Fertilizer and Century Plant in the US and the Weyburn-Midale project in Canada) and Europe (Sleipner and Snøhvit in Norway), although Algeria have also been operating the In Salah project since 2004.

However, it is notable that none of these plants are capturing CO2 emitted from power stations; rather they are capturing from industrial sources from which CO2 arises in a stream suitable for transport and storage. This is particularly important as CO2 emissions from power generation represent the single largest source of global emissions.

For this reason, it is particularly encouraging to note the UK’s leadership position in this area. Following from our signing into law the mandate to mitigate by 80% our GHG emissions by 2050, the Department of Energy and Climate Change (DECC) have recently signed agreements for Front End Engineering Design (FEED) studies for two commercial scale CCS projects; the Peterhead project and the White Rose project.

These are two really exciting projects, both of which represent real world firsts. The Peterhead project is a collaboration between Shell and SSE and is a retrofit of post-combustion capture plant to an existing power plant. This project is intended to operate in a base-load fashion and follows on from the Boundary Dam CCS project in Canada which also uses Shell technology. However, a key distinction between the Boundary Dam and Peterhead projects is the CO2 source; Boundary Dam is a coal-fired power plant whereas Peterhead is a gas-fired power plants. From an engineering perspective, these plants present significantly distinct CCS challenges, and therefore the Peterhead project represents a real step forward.

It is, of course, important to emphasise the importance of the Boundary Dam project. Returning to the IEA’s CCS technology roadmaps, we can see that CCS on coal-fired power plants is of vital global importance; potentially contributing to about 40% of emission mitigation in both OECD and non-OECD countries.

The White Rose project on the other hand is an example of oxy-combustion technology applied to a coal-fired power plant. This project is a collaboration between Alstom, Drax Power and BOC. Here, instead of performing a retrofit, the White Rose project is building a brand new, state-of-the-art 450MWe super-critical power plant which has the capacity to co-fire biomass and coal which, when combined with CCS can lead to the plant producing carbon negative electricity. Importantly, the White Rose plant will have an emphasis on the generation of flexible power; something which is key as we have more and more intermittent renewable energy in our energy system.

Thus, 2014 is the year where CCS on power generation becomes a reality. Given the fact that fossil fuels will remain a vital part of the world’s energy landscape for some time to come, with some sources indicating that they will account for over 66% of the world’s energy by 2100, it is almost impossible to over emphasise the importance of our ability to utilise them in an environmentally benign and sustainable way. For this reason, I believe 2014 represents a pivotal year; one which, in time, we will look back on as being the dawn of the age of sustainable fossil fuels.

The TROPICS research cruise from Tenerife to Trinidad: Tracing oceanic processes using corals and sediments

 By Torben Struve, Research Postgraduate, Department of Earth Science & Engineering  and Grantham Institute for Climate Change

Tropics_logo


How to start a retrospective on two amazing months at sea? Probably at the beginning! In the beginning there was…an idea! The idea was to reconstruct abrupt changes in chemistry and ocean circulation in the Equatorial Atlantic Ocean to learn about global climate and deep-water habitats. The plan was to do so by collecting sediments, seawater and deep sea corals and analysing all of these for their geochemical composition.

Developing this idea into our actual scientific cruise, JC094, took several years of planning and preparation, led by principal investigator and chief scientist Dr. Laura Robinson (University of Bristol) and funded by the European Research Council. The closer the day of embarkation, the busier the participants: on the one hand everyone has to pass medical examinations and safety training courses and on the other hand getting all scientific equipment sorted before leaving port is very important as it is too late to receive mail deliveries once at sea!

IMG_0129 20131129-IMG_5453


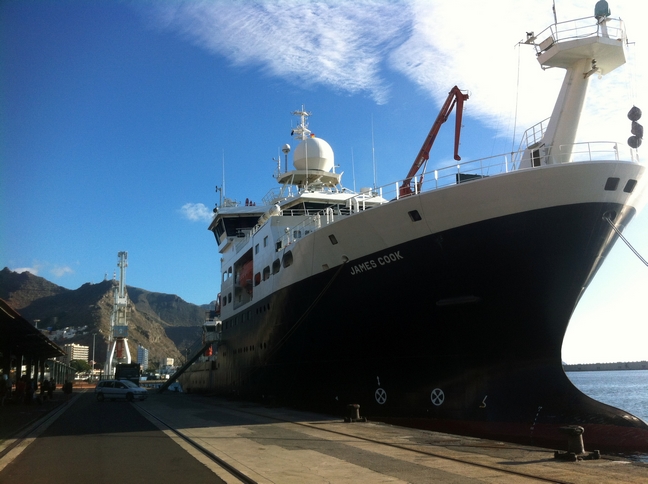
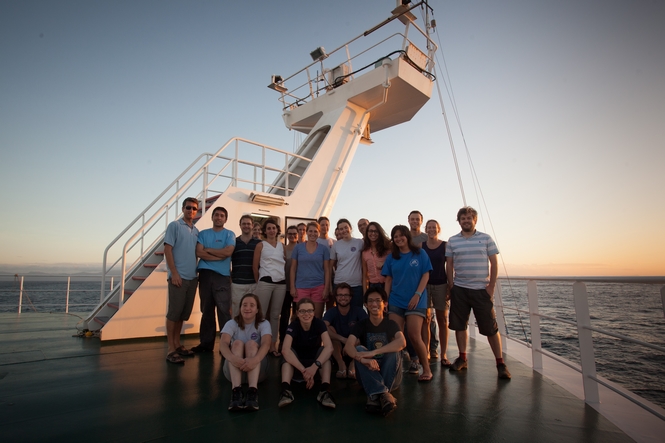
Left: The RRS James Cook at the dock in Tenerife (Photo by: Torben Struve). Right: Science party of expedition JC094. Standing row (left to right): Martin Bridger, James Cooper, Paul Morris, Lucy Woodall, Mélanie Douarin, Stephanie Bates, Michelle Taylor, Allison Jacobel, Veerle Huvenne, Leigh Marsh, Vanessa Fairbank, Kais Mohamed Falcon, Shannon Hoy, Maricel Williams, Peter Spooner, Laura Robinson, Marcus Badger. Sitting row: Jesse van der Grient, Kate Hendry, Torben Struve, Hong Chin Ng. (Photo by: Sam Crimmin)

We were lucky that our vessel, the 89.5 m long RRS James Cook, was docked in Southampton before our cruise, giving us the opportunity to spend a few days at the National Oceanographic Center (NOC) in Southampton to prepare the science facilities on board so that the labs and our equipment are ready-to-go once we were at sea. Our swimming laboratory, the RRS James Cook sailed ahead of us and we met her again for embarkation in Tenerife on the 13th October. On the afternoon of the 13th October we left the port of Tenerife. Although this was our last land experience for seven weeks every participant of this multi-national expedition (British, US, French, Dutch, Belgian, Malaysian, Spanish and German) was excited about finally launching JC094.

Our aim was to collect of a wide range of sample material in order to unravel modern and past secrets of the deep equatorial Atlantic Ocean.

The Atlantic Ocean is separated into two basins by the Mid-Atlantic Ridge (MAR which is part of a global sub-marine mountain range) allowing only restricted deep-water exchange between these basins via the Vema Fracture Zone. The measurement of modern seawater properties is crucial for achieving our scientific goals. The distribution patterns of deep-sea species in the modern ocean are poorly understood and are, besides seafloor topography most likely linked to seawater chemistry. Reconstructions of past ocean properties (paleoceanography) are based on proxies extracted from marine archives, i.e. past seawater properties are reconstructed with chemical tracers extracted for instance from marine carbonates like foraminifera (single-celled organisms) shells or deep-sea corals. Such proxy work relies on modern calibrations of the chemical tracer extracted from live specimen against seawater.

For this purpose we aimed to collect seawater, sediment and a wide range of biological samples including the most-desired deep-sea corals. Our five sampling locations spanned across the equatorial Atlantic from east to west: Carter and Knipovich seamounts in the eastern basin, the Vema fracture zone at the Mid-Atlantic Ridge and the Vayda and Gramberg seamounts in the western basin.

During the expedition the science party was divided into two 12 hour shifts from 4am(pm) to 4pm(am) covering a day’s 24 hour cycle. Each scientist was trained in various methods and techniques in order to help dealing with all the different types of sampling techniques applied during JC094: seawater sampling with a CTD rosette, hydroacoustic surveying, long and short coring as well as collecting and processing coral samples collected with the remotely operated vehicle (ROV) ISIS.

 Map_tropics

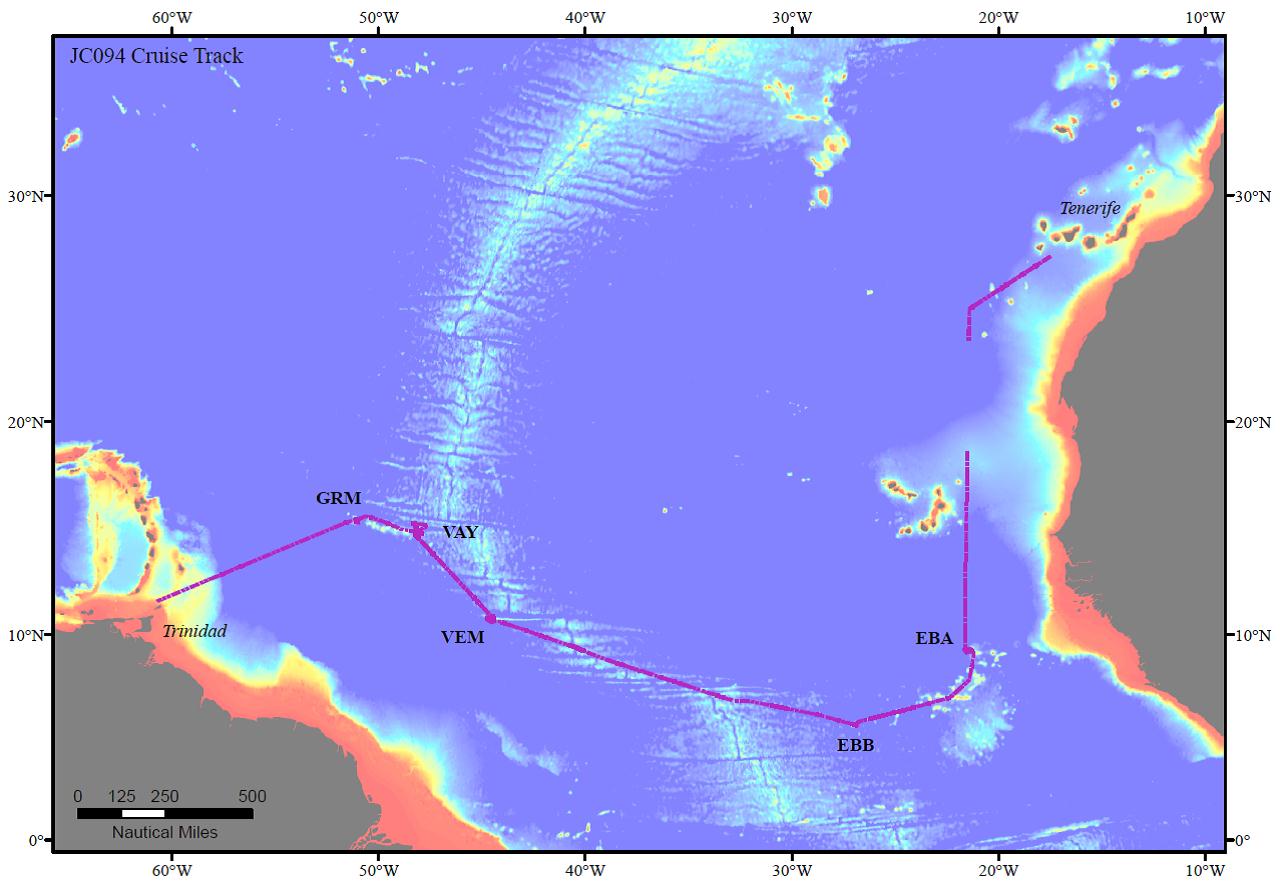
Cruise track of JC094 from Tenerife to Trinidad. EBA: Carter seamount; EBB: Knipovich seamount; VEM: Vema Fracture Zone; VAY: Vayda seamount; GRM: Gramberg seamount. (Map created by: Shannon Hoy)

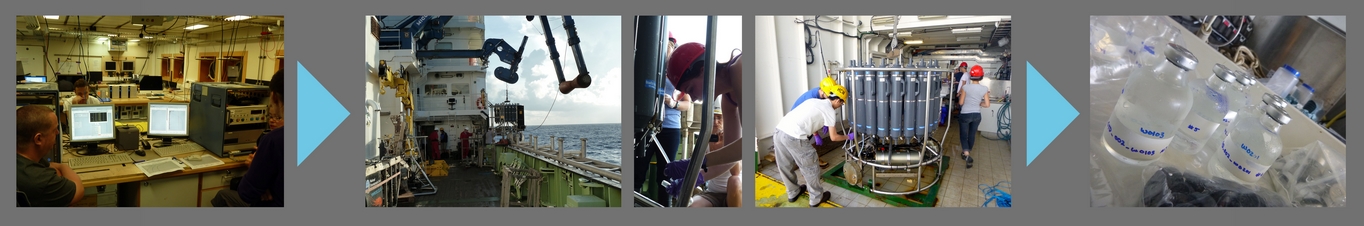
Seawater sampling with a CTD rosette:

Seawater is usually sampled with a CTD rosette (conductivity-temperature-depth) measuring various seawater properties online and collecting seawater samples at particular depths with the 24 Niskin bottles attached to the frame. At every sample location we started our scientific program with a CTD profile. A CTD profile across the entire water column (~4500 m water depth) took about 4 hours making sample collection a time-consuming business. Once back on deck, the actual work started with sampling the Niskin bottles for dissolved oxygen, carbonate chemistry, radiocarbon, nutrients and trace elements following a strict scheme. This could usually be done within one 12 hour shift and the day shift (4 am to 4 pm) had the privilege of processing all CTD rosettes during JC094.

Meanwhile, the ship moved on for hydroacoustic surveying of the sampling location. Such hydroacoustic surveys are crucial to determine good locations for sediment coring and ROV dives since most deep-sea floor in the area has never been mapped.

Water_sampling


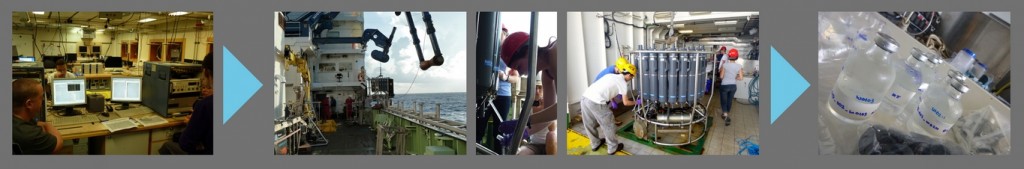
Photo 3 (seawater): Procedure of seawater sampling with a CTD rosette. (1) Sensors reporting back to main lab computer, (2) recovery of the CTD rosette, (3,4) seawater sampling from Niskin bottles and (5) sealed and labeled seawater samples for oxygen isotope analyses (Photos by: (1,2) Torben Struve, (3) Mélanie Douarin, (4,5) Vanessa Fairbank)

Deep-sea sediment sampling:

The sediment coring efforts focused on recovery of surface material, and combined with long cores reaching back to at least the Last Glacial Maximum, i.e. 20,000 years ago. The rate of sediment deposition in the deep sea is on the order of 1-3 cm per 1,000 years and may be dominated by foraminiferal shells. During JC094 we used two different coring techniques: long coring and short coring.

Long coring allows deep penetration of a metal barrel (we used 12 m long barrels) into the sediment providing long sediment records. Once on deck, long cores are cut into 1.5 m segments, split into two halves and sub-sampled for chemical and physical analyses. As a result of the long coring technique the top part of the sediment column (sediment-seawater interface) is disturbed/lost.

Longcoring

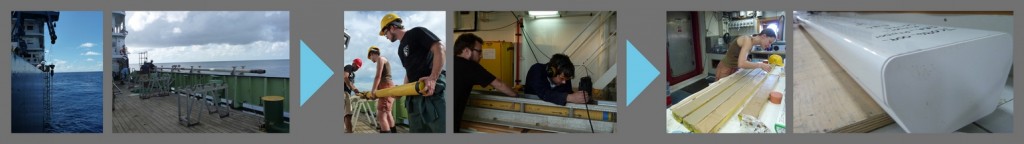
Photo 5 (Long coring): Long coring work flow. (1) Coring device is back at the surface, (2) metal barrel needs to be aligned along starboard before it can be craned back on deck, (3) pulling the core liner (yellow tube) holding the sediments out of the metal barrel and cutting the liner into sections, (4) splitting the core liner sections into two halves: work and archive, (5) archive half of ~ five meter long sediment core and (6) D-tube which is used for long-term storage of sediment core sections. (Photos by: (1,2,4) Torben Struve, (3,5) Mélanie Douarin, (6) Stephanie Bates)

Megacoring allows collection of undisturbed short cores so that both coring techniques complement one another. Most of the short cores are sliced, bagged and stored right away whereas some have been investigated with respect to anthropogenic impact, i.e. microplastics.

Megacoring


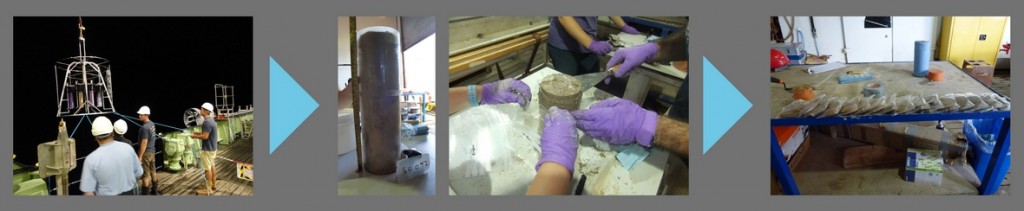
Photo 4 (megacoring): Processing samples from a megacorer. (1) Recovering the megacorer, (2) a single megacore tube on the sediment extraction table, (3) slicing sediments of a megacore tube and (4) sliced and bagged sediment samples. (Photos by: (1) Hong Chin Ng, (2, 4) Mélanie Douarin, (3) Jesse van der Grient)

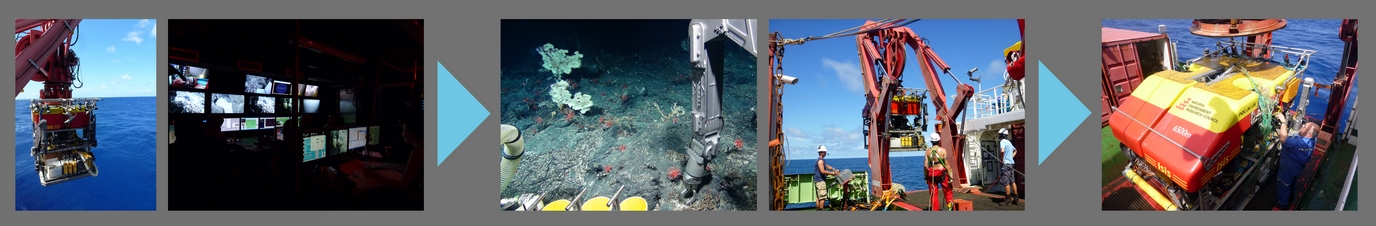
ROV (Remotely Operated Vehicle) dives:

The main focus of this expedition was diving with the ROV (Remotely Operated Vehicle) ISIS which is basically a robot of the size of a small car connected to the ship with a cable. An onboard CTD reported seawater properties, various cameras allowed online seafloor observation, two robotic arms used various tools for selective sample collection and a hydroacoustic system allowed ultra-high resolution seafloor mapping. At any time during a dive, at least three scientists and two pilots (rotating with replacement teams) were in the control unit making sure that we got the most out of every single dive. Such dives could be quite long and during JC094 we also established a new record of longest ISIS diving time, i.e. 43 hours and 43 minutes!

ROVing

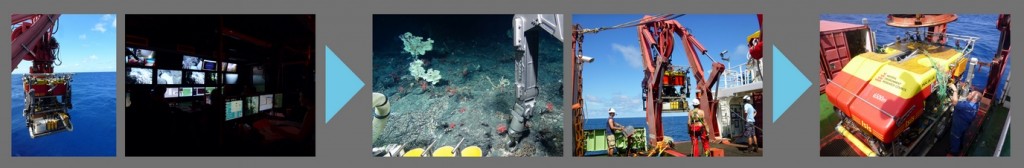
Photo 6: Operating the ROV ISIS from RRS James Cook. (1) Deploying the ROV, (2) insight into the control unit on deck housing screens for the various cameras and instruments onboard ISIS, (3) sample collection at the seafloor with one of the two mechanical arms, (4) recovery of ISIS with the port side A-frame crane and (5) ISIS is back on deck with some unexpected bycatch: fishing lines. (Photos by: (1) Mélanie Douarin, (2) Torben Struve, (3) ISIS, (4,5) Vanessa Fairbank)

Our ROV dive efforts focused on the collection of live and fossil (i.e. dead) sample material, and in particular on deep sea corals. With regard to investigations of past ocean properties, deep sea corals have the advantage of growing in places where sediment deposition is either lacking or discontinuous, i.e. for instance on steep slopes of seamounts and in high current environments. Our cruise track across the Atlantic was designed to target seamounts peaking up to more than 4000 m from the seafloor allowing us to collect samples over a wide depth range. Live coral specimen are used for calibration and method development purposes so that such methods may eventually be applied to fossil deep sea corals revealing secrets about past ocean properties.

Besides deep-sea corals, live specimens of various types of deep-sea species have been collected for DNA analyses which allow drawing conclusions about deep-sea species’ distribution patterns.

Furthermore, we also ran ultra-high resolution seafloor and habitat mapping campaigns with the ROV, trying to investigate potential links between bathymetry and deep-sea species’ habitats. Such data may be combined with the seawater data and thus, unraveling major biogeographical relationships between deep-sea biology, hydrography and bathymetry.

Dive_impressions

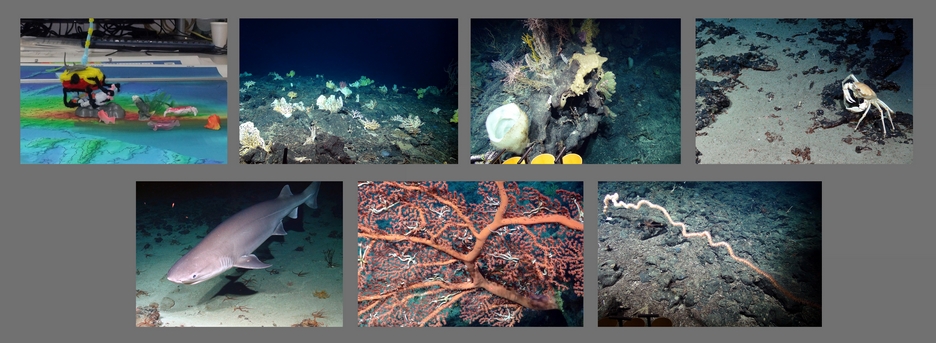
Photo 7: Impressions of deep-sea ROV dives during JC094. (Photos by: (1) Jesse van der Grient, others by ISIS)

The sample recovery from the ROV on deck had to be done quickly: all biological samples including live and fossil deep-sea corals were transferred into the cold room lab for identification, separation and documentation. Sediment and seawater samples collected with the ROV were processed separately from the biological samples. The fossil corals were separated from live samples and transferred into the deck lab for drying, sorting and identification – one of the most puzzling tasks on board!

Sample_sorting

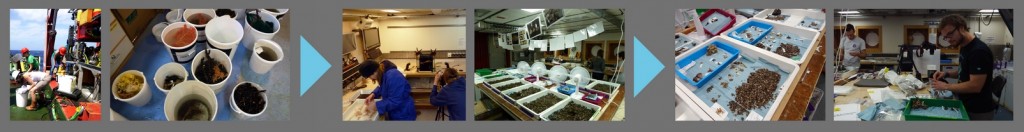
Photo 8: Processing samples collected with the ROV. (1) Sample recovery from the various trays and boxes on ISIS, (2) samples placed in buckets, sorted by water depth and location, (3) sorting, documenting and archiving of biological samples in the cold room, (4) fossil deep-sea coral samples are transferred from the cold room into the deck lab for drying and identification, (5) dried and sorted fossil coral samples waiting for (6) photographing and bagging. (Photos by: (1) Vanessa Fairbank, (2,6) Mélanie Douarin, (3,4) Torben Struve, (5) Hong Chin Ng)

So we moved across the Atlantic Ocean collecting thousands of samples during the seven weeks and everybody was involved in processing all types of samples, preventing the work to become monotonous. Eventually, it came the time to say goodbye and after seven amazing weeks on board RRS James Cook expedition JC094 ended in Port of Spain, Trinidad. Everybody carried home memories of a great experience and scientific success at sea. Now, we’re looking forward to receiving the samples for detailed chemical analyses.

Find out more on the Tropics project website.

China’s carbon intensity reductions continue

By Ajay Gambhir

A fortnight ago a journalist at New Scientist asked me if I’d seen the latest report by the Netherlands Environment Assessment Agency (PBL) and Joint Research Centre (JRC) on last year’s global CO2 emissions figures. He wanted some quick reactions on analysis that showed China’s emissions per unit of economic output (its “emissions intensity”) had declined by over 4% in 2012, compared to 2011 levels. The following analysis is based on my response.

In absolute terms, China’s emissions actually increased by about 3% in 2012, according to the PBL/JRC analysis. But its GDP increased by almost 8% over the course of 2012, so a 3% increase in emissions means between a 4 and 5% decrease in CO2 emissions intensity.

This compares with the 3.5% annual CO2 intensity reduction target in the 12th Five Year Plan, which covers the period 2011-2015 inclusive. 3.5% is the average annual rate of CO2 intensity reductions required over the period 2005-2020, in order that China meets its Copenhagen Accord target (40-45% reduction on 2005 levels by 2020).

What’s particularly interesting is that these reductions have come largely from an increase in renewable energy displacing coal (as opposed, for example, to the offshoring of carbon-intensive industrial output) – lots of hydro, wind and increasingly solar is being deployed in the Chinese power sector. Whilst no form of electricity generation source avoids at least one of the potential problems of local environmental impacts, high costs or variability of output, the increasing share of near-zero-carbon sources in the generation mix gives grounds for optimism in an economy where coal is still dominant (and about 1 coal-fired power station is still being built per week).

However, the challenge to reduce China’s emissions intensity in line with international action that would limit global warming to about 2OC above pre-industrial levels remains a major one. The analysis that I and colleagues at Imperial College and IIASA undertook in 2011 indicated that, if China grew as then projected, with a 6-fold increase in GDP between 2010 and 2050, and its emissions declined to a level of around 3 GtCO2 (equivalent to 1.7 tonnes of CO­2 per person) by 2050, compared to about 8 GtCO­2 in 2010, it would have to reduce its emissions intensity by 6-7% per year on average over that period. This gives an indication of the size of the transformation required.

Also worthy of note is the uncertainty around emissions levels in China. The PBL/JRC analysis has CO2 emissions from fossil fuel combustion and cement rising from about 9.6 GtCO2 in 2011 to 9.9 GtCO2 in 2012, a 3% rise. By contrast the Global Carbon Project’s estimates, released on 18th November, show Chinese emissions rising from 9.1 GtCO2 in 2011 to 9.6 GtCO2 in 2012 – an almost 6% rise. The emissions in these two estimates are not directly comparable, largely because the former includes emissions from international aviation and shipping attributed to China, whereas the latter doesn’t. But estimating emissions is not an exact science (with PBL/JRC noting that there is a 10% range of uncertainty in the Chinese emissions figures), and these two different perspectives tell two different stories.

Nevertheless, during this period of still-strong economic growth it is interesting to see that China’s economy continues to get less carbon intensive. In fact, according to analysis by the UK’s Committee on Climate Change (CCC) earlier this month, China’s CO2 intensity goals for the period 2005 to 2020 mean it is being more ambitious than a range of other countries including the USA and EU27. The challenge now is to meet the 2020 target and then increase the rate of carbon intensity reductions thereafter.

The full New Scientist article is available here.