New blog address
The Climate and Environment at Imperial blog has moved. Visit our new blog.
The Climate and Environment at Imperial blog has moved. Visit our new blog.
by Professor Martin Siegert, Co-director, Grantham Institute
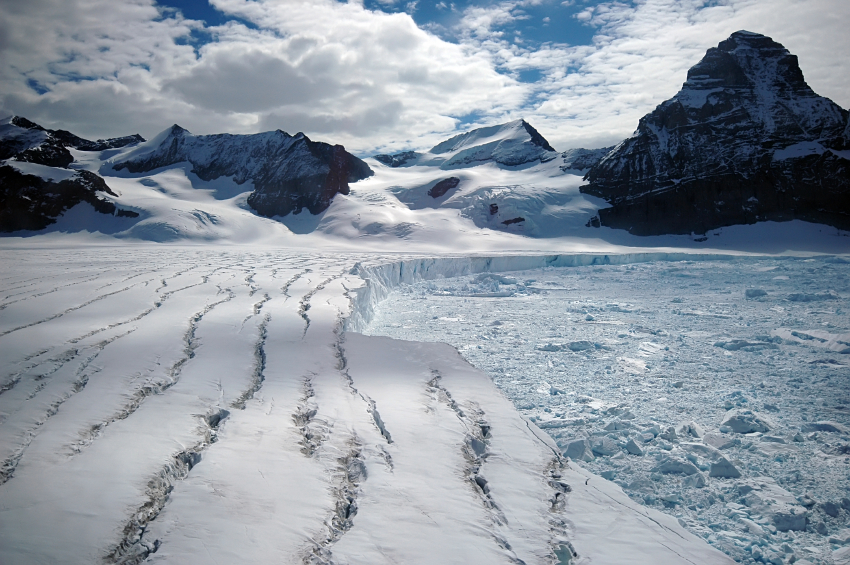 On 27th October I convened a meeting at the Royal Society of London to discuss the results of a recent 20-year research horizon scanning exercise for Antarctic Science (Kennicutt et al. 2014). Part of the discussion focused on the research needed to better quantify Antarctica’s likely contribution to sea level rise in the coming decades and beyond, as published in the new Intergovernmental Panel on Climate Change (IPCC) Synthesis Report.
The report states that, ‘Global mean sea level rise will continue during the 21st century, very likely at a faster rate than observed from 1971 to 2010, and will likely be in the ranges of 0.26 to 0.55 m [in the lowest emissions scenario] … and … 0.45 to 0.82 m [in the highest emissions scenario – the closest to “business as usual”]’. It also states that, ‘Based on current understanding, only the collapse of marine-based sectors of the Antarctic ice sheet, if initiated, could cause global mean sea level to rise substantially above the likely range during the 21st century.’ There is medium confidence that any additional sea level rise would be no more than tens of centimetres.
One of the speakers at the event, Prof. David Vaughan, the Director of Research at the British Antarctic Survey, supported the IPCC’s position by remarking that he knew of no glaciologist who would strongly advocate a different position to this, given the evidence at hand. As a glaciologist myself, I can easily accept Prof. Vaughan’s comment and I don’t believe it is controversial among the community. I was, however, provoked by it to consider the relevant issues a little further, given the uncertainties noted by the IPCC, and to take the opportunity to discuss it with colleagues at the meeting.
Historically, ice sheet responses to global warming have been responsible for sea level changes of a metre or more per century. As the glaciers retreated after the last ice age, sea levels rose by an average of over a metre per century between 20,000 years ago and 10,000 years ago – a total of 120 m. Records also show that the rate of sea level rise can exceed this, however. During the so-called ‘meltwater pulse 1a’ (MWP1a) episode around 15,000 years ago, an increase of around 7 m per century took place. The cause of MWP1a remains uncertain, with some pointing to the rapid decay of the North American ice sheet, whereas others link the change to Antarctica. It may be that both ice sheets were involved to some degree, and the details of the issue remain hotly debated. The point to note is that changes in the cryosphere are certainly capable of causing global sea level to rise at a higher rate than the IPCC suggests.
It is worth considering whether we can rule out the possibility of a new meltwater pulse being locked in somewhere in Antarctica or Greenland, ready to be released to the ocean once some threshold has been reached. As the IPCC notes, several regions of the West Antarctic ice sheet (in particular) and East Antarctic ice sheet appear close to or at a physical threshold of change, where ground ice retreat into deeper (below sea level) terrain leads to further accelerated loss of ice to the sea (often referred to as marine ice sheet instability). Papers earlier this year by Joughin et al. (2014) and Rignot et al. (2014) point to such irreversible change having already begun in the Amundsen Bay region of West Antarctica. According to Joughin et al. (2014) the full effects of such change may take several hundred years, in line with the IPCC’s position. Evidence from the other side of West Antarctica demonstrates a region the size of Wales being highly sensitive to future ocean warming (Ross et al. 2012), and that such warmth may be delivered within a few decades (Hellmer et al. 2012). Across the continent in East Antarctica, the structure of the underlying bedrock reveals evidence of major ice recession in the past (Young et al. 2011), hinting that the ice sheet response to warming is not necessarily restricted to West Antarctica. Indeed while West Antarctica may be losing mass more quickly than anywhere else on the planet, the greatest potential for sea level change lies in East Antarctica, which about ten times greater in volume.
So, after considering Prof. Vaughan’s point that no glaciologist would differ markedly from the IPCC on Antarctic ice sheet collapse, I returned a question to him and those gathered: how can we be sure that the Antarctic ice sheet won’t respond to ocean warming more quickly than expected in certain regions? The answer is we can’t be certain even though, like Joughin et al. (2014), we may consider it unlikely. While I did not dispute Prof. Vaughan’s point, in the light of both recent findings and more established figures on how ice sheets can change during episodes of global warming, there is surely a non-zero risk of much greater sea level rise over the coming decades than the IPCC alludes to.
Quantifying this risk is difficult – maybe impossible at present – and as a consequence is likely to be highly controversial, which is why the IPCC does not tackle it. The problem is that quantifying a non-zero risk of global sea level rise over 1 m in the next 100 years is a far more challenging problem – for both scientists and decision makers – than restricting the debate to what we consider most likely. Maintaining this restriction on the debate is neither safe nor sensible, however.
Glaciologists will point to the research needed on the Antarctic ice sheet’s sensitivity to ocean warming to advance the debate. In 20 years as a glaciologist, I have been surprised on numerous occasions by what we discover about the flow and form of past and present ice sheets. I am utterly certain that amazing new discoveries lie ahead. For this reason, an appropriately sceptical scientific attitude is to accept that our knowledge of Antarctica remains woefully inadequate to be certain about future sea level rise, and to always challenge the consensus constructively.
The solution lies in our ability to model the ice-ocean system in a way that allows confident predictions of the ice sheet response to ocean warming. To do this we need two things. First is better input data, by way of high-precision landscaping beneath the ice sheet in regions most sensitive to change, and in areas where no data have been collected (and there are several completely unexplored parts of the continent). The data collected would also allow us to better understand the process of ice flow in key regions of potential change. A second advance needed is in the coupling of ice-sheet and ocean models. Both are challenging, but well within our abilities to achieve them. Indeed the horizon scanning exercise discussed last week made such investigations a priority.
By Dr Flora Whitmarsh, Grantham Institute
 In a lecture to the Global Warming Policy Foundation, the former UK Environment Secretary Owen Paterson has criticised the current government’s climate and energy policies, suggesting there is too much emphasis on renewables and that the consequences of climate change have been exaggerated. A discussion of Mr Paterson’s comments on UK energy policy appears in another Grantham blog by Dr Simon Buckle. Here I will discuss one of the reasons for Paterson’s position, the belief that climate change has been exaggerated.
Paterson suggested that the Earth has not warmed as much as had been predicted, “ … I also accept the unambiguous failure of the atmosphere to warm anything like as fast as predicted by the vast majority of climate models over the past 35 years, when measured by both satellites and surface thermometers. And indeed the failure of the atmosphere to warm at all over the past 18 years – according to some sources. Many policymakers have still to catch up with the facts.”
If we look back to earlier attempts to quantify global warming, it is now becoming clear that while these attempts were not perfect, they were not hugely inaccurate either. Natural climate variation is more significant than global warming over shorter time periods, but about 25 years have now passed since the earliest attempts to produce policy-relevant projections of rate of warming, and subsequent publications have started to assess how accurate these projections were.
In late 2013, the Intergovernmental Panel on Climate Change (IPCC), a body reporting to the UN, released the first volume of its Fifth Assessment Report. This volume contained an in-depth summary of scientific knowledge about climate science. Scientific understanding of the climate has come a long way since the IPCC released their First Assessment Report in 1990, but the basics of the greenhouse effect were well understood at the time. The projections of future temperature rise in the 1990 report represent the earliest attempt to produce a scientific consensus of opinion regarding the severity of global warming.
A paper published in 2010 by Frame and Stone checked the projections in the First IPCC Report against observed temperature rise. Under the “business as usual” emissions scenario, the IPCC’s best estimate for the projected temperature increase between 1990 and 2010 was 0.55C, within a range of uncertainty. According to two different data sets, temperatures actually increased by 0.35C (HadCRUT3) or 0.39C (GISTEMP) during that period. This is just outside the broader range given by the IPCC, but the IPCC’s range was intended to reflect the uncertainty in the effects of greenhouse gases emissions on the long term warming trend. No attempt was made to include natural climate variability. Frame and Stone performed calculations to account for natural variability using two plausible methods. Both methods showed that the measured temperature increase is consistent with the IPCC’s projections when natural variability is taken into account. In addition, emissions have not been precisely the same as the trajectory used by IPCC, although on this timescale the difference is probably not very significant.
Another early attempt to make policy-relevant projections was published by Hansen et al. in 1988, and results from this work were presented in testimony to the US congress in the same year. Analysis published in 2006 by Hansen et al. demonstrated that the 1988 calculations had been remarkably accurate, with the observed temperatures closely matching those projected under the most realistic emissions scenario. The exceptionally close agreement between the model projections and the observations may have been coincidental since the sensitivity of the climate to carbon dioxide in Hansen’s original model was near the top of the currently accepted range. Nevertheless, the temperature increases projected by the model were close to observations available in 2006.
It is reassuring that these early projections have proved to be of the right magnitude even though the exact rate of warming wasn’t projected. It is worth bearing in mind that the original projections were made about 25 years ago, and the subsequent analysis referenced here was carried out in 2006 and 2010, meaning that only 18-20 years of data is used. This is still not long enough to iron out the full effects of natural variability. Nevertheless, it is now clear that the planet is warming and that humans are responsible, something that could not be concluded unequivocally from the evidence available 25 years ago. It is testament to this overwhelming evidence that those opposed to action on climate change now rely on relatively minor criticisms of climate science to form the basis of their opposition.
Coming to Paterson’s second point, it is indeed true that there has been no significant increase in global surface temperatures in the 21st century so far. However, global warming is not expected to lead to a linear increase in surface temperatures. Indeed, the First Assessment Report of the IPCC, published in 1990, stated that “The [average global surface temperature] rise will not be steady because of the influence of other factors.” Other factors – notably solar cycles, volcanic eruptions and natural climate variation – are known to affect global surface temperatures. The lack of surface temperature increase this century is due to a combination of factors, but almost certainly there has been some contribution from natural changes in the amount of heat taken up by the ocean. It is important to note that the overall heat content of the planet continues to increase and this is still contributing to sea level rise and ice melt.
Paterson continued, “I also note that the forecast effects of climate change have been consistently and widely exaggerated thus far.
“The stopping of the Gulf Stream, the worsening of hurricanes, the retreat of Antarctic sea ice, the increase of malaria, the claim by UNEP that we would see 50m climate refugees before now – these were all predictions that proved wrong.”
There is a hierarchy of uncertainty in climate change prediction. The increase in surface temperatures at a global level due to the greenhouse effect is well understood scientifically. The total amount of heat in the earth system is increasing due to greenhouse gas emissions, which is having the effect of melting ice and snow and warming the ocean, lower atmosphere and Earth surface. All of these impacts, along with ocean acidification from increasing atmospheric carbon dioxide concentrations, are almost certain to continue. Increasing temperatures will also have more complex dynamic effects, including on ocean currents and atmospheric circulation – key aspects of climate variability – as well as on weather patterns, including extreme weather. These impacts are generally harder to predict because there are more factors involved. Putting all of this together and trying to predict the effect of climate change on humans or ecosystems is even more complicated.
The large scale Atlantic Ocean circulation, of which the Gulf Stream forms a part, is driven in part by processes in the North Atlantic that depend on the density of the water in the region. Polar ice melt and changing rainfall patterns due to climate change both have the effect of depositing relatively fresh (and therefore low density) water in the North Atlantic, meaning this process could be affected by climate change. The possibility of a complete shutdown of this North Atlantic circulation has been discussed based on the results of simplified models that show this as a possible outcome. However, mainstream scientific consensus has never been that that this is likely. Again, it is worth going back to older IPCC reports, which form the most comprehensive overview of the scientific understanding of climate change at the time they were written. At the time of the IPCC’s Second Assessment Report in 1995, the available models suggested that the ocean overturning circulation would weaken due to climate change. Subsequent reports in 2001 and 2007 also projected a slowdown and discussed the possibility of a shutdown, but neither report predicted a complete shutdown before 2100. By the time of the latest IPCC report in 2013, the overturning circulation was projected to weaken by between 11% and 34% by 2100. A slowdown has not yet been detected in the observations; this is likely due to the significant natural variability in the strength of the overturning circulation and the limited observational record.
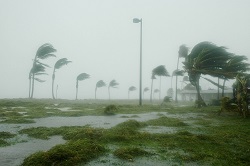
There is more than one way that climate change can affect hurricanes (or tropical cyclones more generally). Heavy rain is almost certainly becoming more frequent and intense globally, and this includes rain that falls during tropical cyclones. In addition there could be an effect on wind speeds or on the frequency of tropical cyclones. The IPCC’s Fifth Assessment Report reported observational evidence that the strongest tropical cyclones in the North Atlantic have become more intense and more frequent since the 1970s, although there is no evidence of a global trend.
There has been a global decline in ice and snow due to climate change. Taking sea ice specifically, Arctic and Antarctic Sea Ice have different characteristics. The Arctic sea ice is more long lived and is declining in both area and mass. Antarctic sea ice is not declining in area because the ice is more mobile than in the Arctic meaning its characteristics are more complex. However since its thickness has not been accurately measured, it is not known whether it has gained or lost mass overall. Sea ice is not to be confused with the Greenland and Antarctic ice sheets, both of which are losing mass. This is discussed in more detail in a previous blog.
Coming back to the hierarchy of uncertainty, changes in malaria incidence and the numbers of potential climate refugees are in the most uncertain group of impacts. These changes depend on the detailed changes in climate in the location under discussion and the response of humans or mosquitos/malarial parasites to that. A change in malaria incidence is still possible, but this remains the subject of research. As well as local climate conditions, the number of climate change refugees would also depend on the response from local people, governments or other organisations in adapting to the effects of climate change. The number of unknowns here makes it very difficult to predict how many people might be displaced by climate change, but this does not undermine our confidence in climate science itself.
 The House of Commons Energy and Climate Change Committee report on the Working Group 1 contribution to the IPCC Fifth Assessment Report, which is published today, has found the IPCC process to be robust. The committee launched an inquiry into the IPCC WG1 report in October 2013, following criticism by some commentators of the IPCC review process and its conclusions.
The Grantham Institute submitted written evidence to the committee (you can read our evidence here) and our Chair Professor Sir Brian Hoskins was called before the committee to give oral evidence.
The committee found that “the IPCC has responded extremely well to constructive criticism in the last few years and has tightened its review processes to make its Fifth Assessment Report (AR5) the most exhaustive and heavily scrutinised Assessment Report to-date. The MPs call on the IPCC to continue to improve its transparency, however. The IPCC would benefit, they say, from recruiting a small team of non-climate scientists to observe the review process and the plenary meetings where the Summary for Policymakers is agreed.”
Commenting on the report Professor Joanna Haigh, Co-Director Grantham Institute said:
“Having assessed a significant quantity of submitted evidence, both written and oral, this report is overwhelmingly supportive of both the procedures and the conclusions of the IPCC. It concludes that the WG1 report is the best available summary of the state of the science of climate change, that improvements to IPCC procedures since the Fourth Assessment have ensured “the highest Quality of scholarship” and that there is no scientific basis for downgrading UK’s ambition to reduce greenhouse gas emissions.
In terms of procedures it recommends two areas of further improvement – the appointment by governments of some non-climate scientists as members of the Executive Committee, and to observe the review process, and a greater level of transparency in plenary meetings discussing the Summary for Policymakers – but these recommendations in no way reflect concern about the content of the Assessment. A whole chapter of the report is devoted to examining criticisms that have been levelled, from both inside and outside the scientific community, on the scientific conclusions but none is found to have significant bearing.
Such a robust report from an all party parliamentary committee surely means that we can now reduce efforts spent on dealing with the constituencies working to discredit the IPCC, concentrate on understanding the science behind climate and climate change and do our best to make sure that the government plays a leading role in achieving a global deal on climate change.”
Professor Sir Brian Hoskins, Chair of the Grantham Institute said:
“The committee recognises that the recent WG1 report of IPCC gives a very good summary of the science relevant to climate change, whilst there are some remaining issues on transparency.
The question now is how do we respond to the risk posed by climate change, and I am pleased to see that the Report is clear: it supports the basis for the advice given by the Climate Change Committee and the path the UK is taking towards its 2050 carbon reduction target, in particular the 4th Carbon budget recently confirmed by Government, it advises that the UK Government at the top level should play a major role in international discussions leading up to Paris 2015.”
By Helena Wright, Research Postgraduate, Centre for Environmental Policy
Helena Wright, an Imperial PhD student, looks at worst possible scenarios from the IPCC Working Group II report.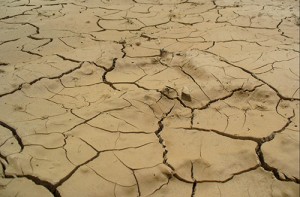
The United Nations’ Intergovernmental Panel on Climate Change (IPCC) recently released its latest report, featuring the most up-to-date science on global climate change.
As a researcher, I had an opportunity to contribute to a table in one of the chapters and have read through each of the 30 chapters of the Working Group II report (on Impacts, Adaptation, and Vulnerability). Here is my personal take on seven of the most frightening findings from the WG2 report:
The health chapter explains how climate change will affect global health, including direct impacts of heat stress, drought and extreme events, as well as indirect impacts on nutrition and mental health.
One extremely frightening direct effect could actually be from CO2 itself. A recent study found indoor CO2 levels of 1000ppm (parts per million) can impair human decision-making performance and cognition. Current atmospheric levels are 400ppm and rising fast. Some scenarios have us reaching these levels by 2100. If these effects are confirmed, how will we be able to adapt?
One particularly frightening aspect of climate change is its impact on children. This is a long term problem with implications for future generations.
Also, children, young people and the elderly are at increased risk of climate-related injury and illness. One study in Nepal found flood-related mortality was twice as high for girls as for women, and was higher for boys than men. Children are more vulnerable to impacts like malaria and diarrhoea for physiological reasons, and also more vulnerable to heat stress.
The coastal chapter explains carbonate reef structures would degrade under a scenario of 2°C by 2050-2100. Increasing levels of atmospheric CO2 also cause the ocean to acidify, causing coral reefs to lose their structural integrity. The North Atlantic and North Pacific are already becoming more acidic.
Coral reefs are important for biodiversity and account for 20-25% of fish caught in developing countries, as well as housing many other marine creatures. Skeletal “dissolution” is expected to be widespread by 2100. The most frightening thing of all is that these are the impacts under business-as-usual scenarios. Average global temperature has already risen by 0.8°C since 1880. Global leaders have only agreed to limit warming to 2°C of warming, a target they are currently missing.
Over 70% of agriculture is rain-fed, so agriculture and food security are highly sensitive to changes in rainfall. Higher temperatures have an impact on crop yields. Climate change will affect rivers and oceans as well. Some scenarios forecast widespread fish extinctions in rivers. In one study where data was available, as much as 75% of local fish biodiversity would be ‘headed toward extinction’ by 2070 due to climate change, particularly in tropical areas.
Food price rises triggered by climate shocks disproportionately affect the poor who tend to spend a higher proportion of their income on food.
Climate change will impact on international trade in both physical and value terms. For example, coffee is a major traded beverage which is sensitive to climate variability. Coffee crops will be forced to move to higher altitudes where they are available. Millions of rural people rely on coffee, tea and cocoa production.
The economic costs are expected to be huge. For example, in Ethiopia, agricultural decline is projected to cause a 10% decline in GDP against benchmark levels. While trade can help countries to adapt, for example by importing food, deficits may have to be met by food aid.
High food prices can impact on socio-political stability. For example, 14 countries in Africa experienced food riots in 2008 during the 2008-9 price spike.
People can also be displaced by extreme weather events. But migrants do not necessarily reach safety; with new migrants more at risk at destinations in cities. Sea level rise is projected to lead to permanent displacement as coastal areas become uninhabitable. Under 2 metres of sea level rise, 187 million people are expected to be displaced.
Chapter 12 also examines research on links between climate change and armed conflict. Many of the factors that increase the risk of civil war are sensitive to climate change. US Military experts recently called climate change “a catalyst for conflict”.
Finally, there are limits to adaptation. This means we cannot adapt to many of these impacts. For example, 31 Native Alaskan villages are facing “imminent threats” due to coastal erosion and several decided to relocate – but their ability to relocate also depends on financial support. Examples of ‘hard’ limits to adaptation include water supply in fossil aquifers, limits to retreat on islands, and loss of genetic diversity. In such cases climate change will lead to irreversible losses.
There are various ‘tipping points’ in the earth system which, if crossed, could trigger rapid and catastrophic climate change. Only mitigation can avoid such risks. Unfortunately little is known about where exactly these ‘thresholds’ lie, making the risks even more difficult to manage.
The limits to adaptation explain why global emission reduction is so vital for humanity. 3-4 degrees of warming would be much more difficult to adapt to than 2 degrees to and could result in the collapse of systems. Yet current climate pledges leave us heading to a world 3.7 degrees warmer. The IPCC shows global emissions are still rising rapidly and show no signs of stabilising. We are entering a radically different world.
However, there are reasons for hope. The UNFCCC negotiations took place again last month in Bonn, with the aim of reaching a global climate deal. There are signs of leadership from the US and China, the worlds’ two biggest emitters, offering renewed hope that collectively we can tackle this problem.

Governments, planning authorities, companies and individuals all need information about the impact of climate change on extreme weather in the future. A recent paper [1] investigates changes in extremes both globally and locally.
We can be relatively certain of the signature of climate change on a global or continental scale. On the other hand, estimating changes on a country-wide scale is harder and estimating them on a local scale (i.e. to the nearest few kilometres) is very difficult.
In the new study, scientists calculated the proportion of global land area in which certain weather extremes are expected to increase. This can be projected more accurately than the change at an individual location.
The researchers found that the hottest temperatures will get even hotter in half of the global land area within 30 years. This is more useful than simply saying that extreme temperatures will become hotter on average globally. It is also more accurate than making predictions about particular locations.
What impact is climate change having on extreme temperatures and precipitation?
Climate change is already having an impact on the weather we experience. As mean temperatures have increased, the extreme hottest and coldest temperatures have also gone up.
Rainfall patterns have shifted, and there has been an increase in heavy rainfall over most land areas since 1950 (IPCC, 2013).
Globally, these trends are expected to continue over the coming decades. Future trends at a local scale may be obscured by the natural variability of the climate.
Why is this paper interesting?
This study confirms that there are significant uncertainties in how extreme temperature and rainfall will change locally. In some regions, there will probably be no change in extreme weather over the next thirty to fifty years. A small proportion of places may even see a reduction in extreme temperatures or heavy rainfall events over this time period.
Importantly, these uncertainties are mainly due to the natural variability of the climate. Uncertainties in climate models are much less important. Even a perfect model could not accurately project changes in extremes locally on a thirty to fifty year timescale.
Despite this uncertainty, the study found that it is possible to estimate changes in extreme weather as a proportion of global land area. This technique turned out to be more reliable than making projections for individual regions. It is also more informative than the global average change in extremes.
This technique is not completely new, but the paper adds to a body of research looking at how to predict future extremes.
What does this mean for decision makers?
Reinsurance firms and commodities traders both operate in global markets. They could use this technique to evaluate changes in risk, helping to set premiums or prices more appropriately.
Local planners will probably still opt to build resilience to climate threats. This study does not provide any new information about the impacts of climate change on a local level.
This study does however provide further evidence that it is not possible to predict the pace of change locally. There is little reason to wait for more certainty in the science before beginning to build in greater resilience to extremes.
What methods were used in the paper?
The paper measures the proportion of land that will experience an increase or decrease in extremes. The paper assesses changes in the frequency of:
Climate models were used to estimate the proportion of global land area in which the above four measures will increase or decrease, and by how much. Firstly, the results of computational simulations using many different climate models were analysed to provide a measure of model uncertainty.
Secondly, the same climate model was run several times with slightly different atmospheric initial conditions. This provided a measure of the uncertainty due to climate variability.
What were the main conclusions?
There are significant uncertainties in how temperature and precipitation extremes will change on a regional scale. These uncertainties are largely due to climate variability, rather than any errors in how models represent climate processes.
The proportion of global land area that will be affected by changes in extremes can be estimated much more reliably. This technique should prove useful to organisations who can make use of global scale information about climate change impacts.
Half of land areas are expected to have hotter temperature extremes within 30 years.
By the period 2016-2035 there is expected to be an increase in the proportion of land areas that will experience intense precipitation.
Further reading from the Grantham Institute
Grantham Briefing Note 1: The slowdown in global mean surface temperature rise
Grantham Briefing Note 5: The changing water cycle
References
[1] Robust spatially aggregated projections of climate extremes, E. M. Fischer, U. Beyerle & R. Knutti. Nature Climate Change (2013).
[2] IPCC, 2013: Climate Change 2013: The Physical Science Basis. Contribution of Working Group I to the Fifth Assessment Report of the Intergovernmental Panel on Climate Change [Stocker, T. F., D. Qin, G.-K. Plattner, M. Tignor, S. K. Allen, J. Boschung, A. Nauels, Y. Xia, V. Bex and P. M. Midgley (eds.)]. Cambridge University Press, Cambridge, United Kingdom and New York, NY, USA, in press. Available on the web at: http://www.climatechange2013.org/report/review-drafts/.
BBC’s Question Time on 14 November saw Lord Lawson citing the IPCC findings to support one of his arguments. Did I dream that? Then I realised that, of course, the reference to the IPCC was incomplete and misleading so I knew I was awake and back in the strange media-distorted world of the UK debate on climate change.
According to the Daily Express, Lord Lawson said that “If you look at the inter-governmental panel on climate change they say there is absolutely no connection between climate change and tropical storms.” Wrong, but convenient for someone who argues we probably don’t need to do anything much about climate change.
What the IPCC actually said in the admirably cautious Technical Summary of the Fifth Assessment Report (AR5) was that:
“Globally, there is low confidence in attribution of changes in tropical cyclone activity to human influence. This is due to insufficient observational evidence, lack of physical understanding of the links between anthropogenic drivers of climate and tropical cyclone activity, and the low level of agreement between studies as to the relative importance of internal variability, and anthropogenic and natural forcings.”
So far so good for Lord Lawson, but then, the IPCC goes on to say:
“Projections for the 21st century indicate that it is likely that the global frequency of tropical cyclones will either decrease or remain essentially unchanged, concurrent with a likely increase in both global mean tropical cyclone maximum wind speed and rain rates (Figure TS.26). The influence of future climate change on tropical cyclones is likely to vary by region, but there is low confidence in region-specific projections. The frequency of the most intense storms will more likely than not increase substantially in some basins. More extreme precipitation near the centers of tropical cyclones making landfall are likely in North and Central America, East Africa, West, East, South and Southeast Asia as well as in Australia and many Pacific islands.” (my emphasis).
In making this statement, the IPCC reflects the fact that, while the science is by no means settled, there are a number of studies that provide physical mechanisms linked to climate change that suggest the frequency of the most intense storms would increase with warming. As I understand it, the warmth of the near surface ocean provides the basic fuel for the cyclone: the winds spiralling around the system evaporate water which cools the ocean and puts latent heat into the atmosphere. When the air rises and the water condenses in deep convection in the storm the heating leads to extra ascent, drawing in more air and leading to faster surface winds. The warmer the ocean is, the more fuel there is for a potential tropical cyclone, and the stronger they could be. Many other aspects come into play such as the changing winds with height and the temperature of the atmosphere up to 15 km. However, in a warmer world, the potential for stronger storms is there.
Indeed, based on this sort of evidence, the quote highlighted above is a statement that the IPCC judges there is more than a 50% chance that the frequency of the most intense storms will increase substantially in some ocean basins. So if Typhoon Haiyan was not affected by climate change and yet was still one of the most powerful storms ever making landfall, it’s clear that the Philippines and other regions exposed to tropical cyclones have a lot to worry about unless we make a “substantial and sustained reductions of greenhouse gas emissions (SPM Section E).” It would be good to see Lord Lawson quoting that particular part of the IPCC AR5 report!
The IPCC has released corrected figures for past carbon dioxide emissions and future emissions trajectories quoted in the Summary for Policy Makers of the Working Group 1 report, “Climate Change 2013: The Physical Science Basis”. The original numbers were published in the report released on 27th September, which was subject to copy edit and final layout changes.
In total, six values from the summary have been changed. As noted by Professor Sir Brian Hoskins, Director of the Grantham Institute, these corrections are minor adjustments to historical greenhouse gas emissions and to the cumulative emissions consistent with achieving a 2 degree warming target with different levels of probability. The 2 degree target is significant because it forms the basis of international climate change negotiations. These minor corrections do not affect any of the conclusions drawn in the Summary for Policy Makers.
Since the IPCC did not do so, I have produced the following table to compare the new values to the original values for all the parameters that have changed. For each parameter, the difference between the original best estimate and the new best estimate is given in the right hand column. This is also expressed as a percentage of the original value. As can easily be seen, the changes in the parameters are all relatively small compared to the values of those parameters. Most are also small compared to the 90% uncertainty interval (range) given.
If you are unable to read the table below you can also view it here.
| Section of the SPM affected | Parameter changed | Value given in the version released on 27th Sep 2013 (gigatonnes of carbon, GtC) | New values, released 11th November 2013 (all in gigatonnes of carbon, GtC) | Comment |
| Section B.5, bullet 4 | Cumulative CO2 emissions from fossil fuel combustion and cement production over the period 1750 to 2011. | 365 [335 to 395] | 375 [345 to 405] | The best estimate and range revised upwards by 10 GtC, an increase of 2.7% in the best estimate. |
| Section B.5, bullet 4 | Cumulative anthropogenic CO2 emissions over the period 1750 to 2011. | 545 [460 to 630] | 555 [470 to 640] | Best estimate and range revised upwards by 10 GtC, an increase of 1.8% in the best estimate. |
| Section B.5, bullet 5 | The accumulation of carbon from anthropogenic CO2 emissions in natural terrestrial ecosystems over the period 1750 to 2011. | 150 [60 to 240] | 160 [70 to 250] | Best estimate and range revised upwards by 10 GtC, an increase of 6.7% in the best estimate. |
| Section E.8, bullet 2 | Total cumulative CO2 emissions from all anthropogenic sources to limit warming to less than 2°C (from CO2 alone) since the period 1861–1880 with a probability of >33%. | 0 to 1560 | 0 to 1570 | The maximum value was revised upwards by 10 GtC, a percentage increase of 0.64%. |
| Section E.8, bullet 2 | The maximum cumulative CO2 emissions from all anthropogenic sources for limiting warming to less than 2°C (including non-CO2 forcing as in RCP2.6 – the lowest emissions scenario used by the IPCC) listed for probabilities of >33%, >50%, and >66%. | 880, 840 and 800 | 900, 820 and 790 | Numbers changed by +20, -20 and -10 GtC. The percentage changes were +2.3%, -2.4% and -1.3%. |
| Section E.8, bullet 2 | Cumulative anthropogenic CO2 emissions over the period 1870 to 2011. | 531 [446 to 616] | 515 [445 to 585] | Best estimate reduced by 16 GtC, a decrease of 3%. Range also reduced from 170 to 140 GtC. |
Two years to go and counting down. That’s the real significance of COP19, the Warsaw Conference of the Parties of the UN Framework Convention on Climate Change (UNFCCC), which runs from 11-22 November. A new universal climate agreement effective from 2020 is what is at stake, and Warsaw is a step on the path.
The COP21 meeting in Paris at the end of 2015 will hopefully be the successful culmination of many years’ of hard work by the UNFCCC Secretariat, government climate negotiators and many, many others. It’s time for governments to act on the words they agreed in the IPCC Summary for Policy Makers launched on 27 September – namely that substantial and sustained reductions in emissions are required to limit climate risks. No doubt this is a point Ban Ki-Moon will make at his planned high-level Climate Summit in September 2014.
So how important is the Warsaw COP in this packed schedule to Paris? According to Christiana Figueres, the Executive Secretary of the UNFCCC Secretariat based in Bonn, the meeting is “a pivotal moment to advance international climate action and showcase a growing momentum to address climate change at all levels of society”. That’s why there’s a Business Forum and a “Cities Day”. There is also a Gender Day to showcase women’s role in meeting the climate challenge – a very welcome initiative since the differential impacts on distinct societal groups with contrasting interests and values is at the core of how we decide to respond – or not – to climate change.
Climate change is a critical issue for business, and business has to be part of the solution. Companies realise that they can both become more profitable and improve business resilience by taking climate change and energy efficiency seriously. We need to scale up these efforts significantly to limit the risks from climate change. The car industry is a good example of where European emissions regulation has encouraged innovation to reduce emissions. However, businesses often have shareholders as well as customers and there is only so much they can do without a clear policy framework, a meaningful carbon price to capture the damage emissions do to others and adequate incentives for innovation and investment in clean technologies and new businesses, rather than in the old economy.
There is also a growing recognition that there are clear benefits, even in the short-term, from tackling climate change, including greater energy security. Cities as key concentrators of human, financial and physical capital and resource use are at the forefront of efforts to make the transition to a lower impact and more resilient way of life. In rural areas, renewable technologies can play a valuable role in extending energy access for poor people in developing countries – a role that will grow as technologies get better and cheaper.
But Warsaw has to be about more than just showcasing what could be if we really tried. To create the political conditions for an ambitious and effective mitigation agreement in 2015 covering all the major emitters, there’s a huge amount of hard work still to be done. Warsaw can contribute by helping mobilise governments to deliver an ambitious and effective climate agreement in Paris in 2015. Well before the end of next year, we need all the major emitting economies to have put on the negotiating table national commitments to significant and verifiable emissions reductions beyond 2020, with the degree of effort tailored to particular national circumstances. This is not like the Kyoto Protocol. Emissions reductions are needed from developing as well as developed economies; the climate doesn’t care where the emissions come from.
Of course, vulnerable, developing economies will need help to make the transition to low-carbon, resilient economies. So a successful outcome in Paris depends on the quantity and quality of financial, technological and adaptation support that the UNFCCC institutions can mobilise for these countries. Warsaw will hopefully take decisions to make the Green Climate Fund, the Technology Mechanism and the Adaptation Committee fully operational. But institutions are not enough in themselves. The developed economies have to deliver on their promises of additional financing. Clarity on plans to scale up finance to 2020 will be critical to success in Paris in 2015.
The great advantage of the UN process in tackling climate change is that it brings together over 190 countries with very diverse capacities and perspectives in a sustained effort to create an effective global response to climate change. The voices of the poor and vulnerable can be effective in putting moral pressure on the rich. The UNFCCC process should help us avoid a situation where the climate risks faced by the majority are determined by the decisions of the few.
This strength is of course also the UNFCCC’s Achilles Heel. International agreements cannot bind national governments if they don’t want to be bound. So whatever is agreed at Paris can only be as ambitious as countries judge is in their own interest, taking account of what others are doing in their self interest. This is why there have been persistent calls for “bottom-up” approaches. While focused groupings, like the Major Economies Forum, can make a valuable contribution to the process, we need the UN process to keep up the pressure and also to provide an independent mechanism for monitoring, reporting and verifying countries’ emissions reductions.
As we’ve seen with the national pledges made after the Copenhagen COP, an agreement in Paris that is based purely on what countries want to do is unlikely to meet the scale of the challenge. Time is short, perhaps 50 years to make the transition to a much lower carbon world. This is why the UNFCCC is absolutely right to seek to involve a much wider range of non-governmental actors in the discussions at Warsaw and beyond, to try and raise the level of ambition and to redefine what is feasible.
The future of our planet is far too important to be left just to our politicians.