Category: Grantham work themes

Fact checking a recent Telegraph article by Christopher Booker

by Dr Flora WhitmarshGrantham Institute

newspaperIn an article for the Telegraph, Christopher Booker gave his views on Professor Sir Brian Hoskins’ appearance on the Today programme earlier this year. In the article, Booker made several claims about climate science relating to rainfall, atmospheric humidity, polar sea ice extent, global temperatures and sea level rise. In this blog I will assess his claims against the findings of the latest report of Working Group 1 of the Intergovernmental Panel on Climate Change (IPCC), a hugely comprehensive assessment of the scientific literature.

  Rainfall and floods

Booker’s comment: “Not even the latest technical report from the UN’s Intergovernmental Panel on Climate Change (IPCC) could find any evidence that rainfall and floods were increasing.”

 Scientific Evidence:

The IPCC report found a significant climate influence on global scale changes in precipitation patterns (with medium confidence), including increases in precipitation in northern hemisphere mid to high latitudes. Further evidence of this comes from the observed changes in sea level salinity, an indication of the global distribution of evaporation and precipitation. The data is currently too inconclusive to report other regional changes in rainfall with confidence. Overall, however, there had been little change in land-based precipitation since 1900, contrasting with their 2007 assessment, which reported that global precipitation averaged over land areas had increased.

The IPCC concluded that there continues to be a lack of evidence and thus low confidence regarding the sign of trend in the magnitude and/or frequency of floods on a global scale.

The IPCC’s projected short-term changes (2016-35) in rainfall were:

  • Increased mean precipitation in the high and some of the mid latitudes (very likely)
  • Reductions in the sub-tropics (more likely than not).

There is also likely to be an increase in the frequency and intensity of heavy precipitation events over land. Regional changes will be strongly affected by natural variability and will also depend on future aerosol level (emissions and volcanic) and land use change.

Global rainfall totals are expected to go up in the longer term (i.e. beyond 2035) by around 1-3% per degree Celsius of global mean surface temperature increase, except in the very lowest emissions scenario.

Booker is partially right on past changes: the IPCC found no significant trend in global average rainfall over land. But this is not to say there has been no effect. Indeed, the expected increase in extreme heavy rain is already happening: the IPCC concluded with medium confidence that since 1951 there has been an increase in the number of heavy precipitation events in more regions than have had a decrease.

Read more about the impacts of climate change on UK weather

Atmospheric humidity

Booker’s comment: “From the official National Oceanic and Atmospheric Administration (NOAA) satellite data on humidity (shown on the “atmosphere page” of the science blog Watts Up With That), we see it has actually been falling.”

 Scientific Evidence:

The key measure of whether atmospheric humidity is rising or falling is specific humidity, i.e. the mass of water vapour in a unit mass of moist air.  The “atmosphere page” of “Watts Up With That” when accessed on 17 July wrongly shows data on relative humidity under the heading “Specific humidity”. Relative humidity is a measure that depends on temperature and does not therefore measure the absolute water vapour content of the atmosphere. In other words, Booker’s evidence is not evidence.

The latest IPCC report concludes that it is very likely that global near surface and tropospheric air specific humidity have increased since the 1970s.  However, during recent years the near-surface moistening trend over land has abated (medium confidence).  The magnitude of the observed global change in water vapour of about 3.5% in the past 40 years is consistent with the observed temperature change of about 0.5°C during the same period.  The water vapour change can be attributed to human influence with medium confidence.

Polar ice melt

Booker’s comment: “As for polar ice, put the Arctic and the Antarctic together and there has lately been more sea ice than at any time since records began (see the Cryosphere Today website).”

 Scientific Evidence:

The IPCC found that since 1979, annual Arctic sea ice extent has declined by 0.45-0.51 million km2 per decade and annual Antarctic sea ice extent has increased by 0.13-0.20 million km2 per decade. Taking the two IPCC estimates together, it can be inferred that total global sea ice extent has declined since 1979.

Sea ice thickness is harder to measure. The IPCC combined submarine-based measurements with satellite altimetry, concluding that Arctic sea ice has thinned by 1.3 – 2.3 m between 1980 and 2008. There is insufficient data to estimate any change in Antarctic sea ice thickness.

The reason why the Arctic sea ice has declined and the Antarctic sea ice hasn’t is because they have very different characteristics. Arctic sea ice is constrained by the North American and Eurasian landmasses to the south. In the central Arctic Ocean, the ice can survive several years, which allows it to thicken to several meters.  Due to climate warming, the Arctic summer minimum has declined by around 11.5% per decade since 1979, and the extent of the ice that has survived more than two summers has declined by around 13.5% per decade over the same period. This has serious consequences for the surface albedo (reflectance) of the Arctic, as a reduction in the highly reflecting sea ice with less reflective open water results in enhanced absorption of solar radiation.

In contrast to the Arctic, Antarctic sea ice forms in the open ocean with no northern land to constrain its formation. The vast majority of Antarctic sea ice melts each summer.

Booker mentioned sea ice specifically, but he did not mention the other important components of the global cryosphere. Making use of better observations than were available at the time of their previous report in 2007, the IPCC carried out an assessment of all the ice on the planet and concluded that there had been a continued decline in the total amount of ice on the planet. The Greenland and Antarctic ice sheets are both losing mass (with very high confidence and high confidence respectively). Glaciers are known to be declining globally (with very high confidence). Overall snow cover, freshwater ice and frozen ground (permafrost) are also declining, although the available data is mostly for the Northern hemisphere.

 Temperature

Booker says: “As for Sir Brian’s claim that by 2100 temperatures will have risen by a further ‘3-5oC’, not even the IPCC dares predict anything so scary.”

 Scientific evidence:

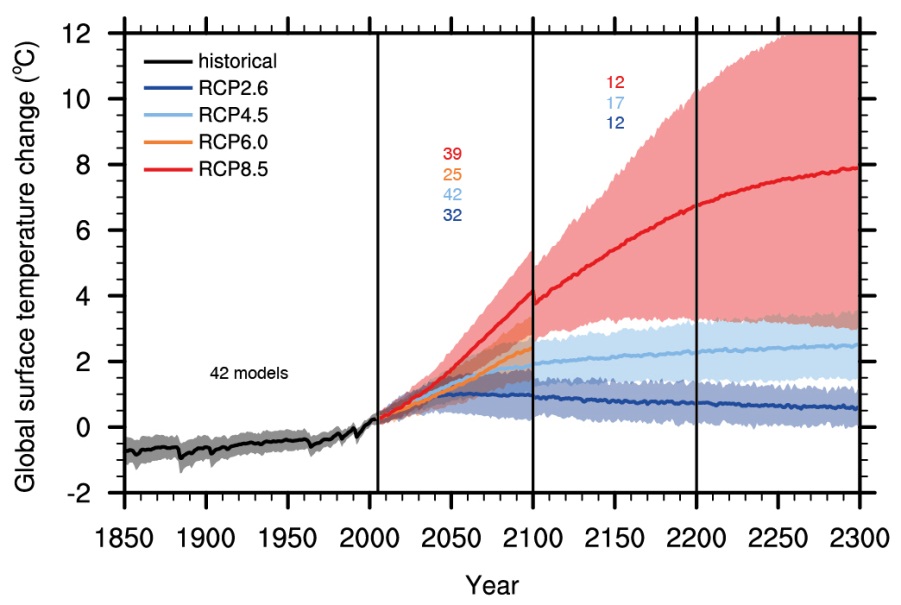
Future temperature rise of course depends on greenhouse gas emissions. In the lowest of the IPCC emissions scenarios, which assumes that global carbon dioxide emissions will decline after 2020, reach zero around 2080, and then continue dropping to just below zero by 2090, temperatures are projected to increase by another 0.3oC – 1.7oC by 2100. Total warming under this scenario is projected to be 0.9oC – 2.3oC relative to 1850-1900, i.e. including warming over the 20th century.  Under the highest emissions scenario, the closest to business as usual, another 2.6oC – 4.8oC of warming is projected by 2100. In this case, the total projected temperature rise by 2100 is 3.2oC – 5.4oC when past temperature rise is included.

It is worth emphasising that if emissions are not constrained then we are likely to see a temperature rise of the same order as the projections under the IPCC’s highest emissions scenario. All three of the other scenarios assume that carbon dioxide emissions will peak and then decline substantially at some point in the coming decades. If emissions continue to rise then we should expect a total temperature increase in the region of 3.2oC – 5.4oC by the end of the century. This can of course be avoided if action is taken to reduce fossil fuel dependency.

Booker says: “[Professor Hoskins] was never more wobbly than when trying to explain away why there has now been no rise in average global temperatures for 17 years, making nonsense of all those earlier IPCC computer projections that temperatures should by now be rising at 0.3C every decade.”

 Scientific evidence:


Past global surface temperature rise
Figure 1: Past global surface temperature rise according to the MLOST, HadCRUT4 and GISS datasets (IPCC, 2013). There is a long term increase in temperature, but also natural variability.

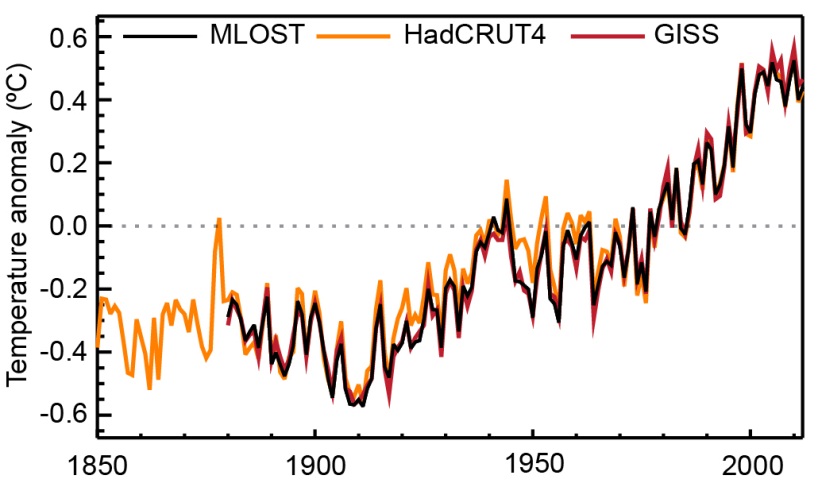
Climate change is a long term trend, and a few decades worth of data are needed to separate the warming trend from natural variability.  Global mean surface temperature increased by about 0.85oC over the period 1880-2012. Each of the last three decades has been warmer than all previous decades in the instrumental record and the decade of the 2000s has been the warmest.

The observed temperature record over the 20th Century shows periods of slower and faster warming in response to a number of factors, most notably natural variability in the climate system, the changes in atmospheric composition due to large-scale human emissions of greenhouse gases and aerosols from burning fossil fuels and land-use change, volcanic activity and small changes in the level of solar activity.

In future, there will continue to be natural variation in temperature as well as a long term warming trend due to our greenhouse gas emissions. Significant natural climate variability means that a prolonged continuation of the current slowdown in the rate of increase would not on its own be strong evidence against climate change, provided that: 1) the global mean sea level continued to rise due to thermal expansion of the oceans, the melting of glaciers and loss of ice from ice sheets, and 2) the measured net energy flow into the climate system (predominantly the ocean) remained significantly positive.

The climate models used by the IPCC are not designed to predict the exact temperature of the Earth surface in a particular year or decade. This would require scientists to predict the future state of climatic phenomena such as the El Niño Southern Oscillation or the Pacific Decadal Oscillation for a specific period several years in advance, something that is not currently possible. Volcanic eruptions also have an impact on global temperatures, and they are not known about far enough in advance to be incorporated into the IPCC’s model projections.

Read more in our Grantham Note on the slowdown in global mean surface temperature rise

The future projected increase in global surface temperature
Figure 2: The future projected increase in global surface temperature (IPCC, 2013). All the results are based on several model runs (numbers of model runs shown in the appropriate colours). The red line shows the highest emissions scenario, the closest to business as usual. The dark blue line shows the lowest emissions scenario, which assumes continued reductions in emissions after 2020, and the other two lines (orange and light blue) are intermediate scenarios.

Sea level rise

Booker says: “NOAA’s data show that the modest 200-year-long rise in sea levels has slowed to such an extent that, if its recent trend continues, by the end of the century the sea will have risen by less than seven inches.”

Scientific evidence:

Past sea level rise according to six datasets
Figure 3: Past sea level rise according to six datasets (IPCC,2013). These are based on tide gauge measurements – satellite data is included after 1993.

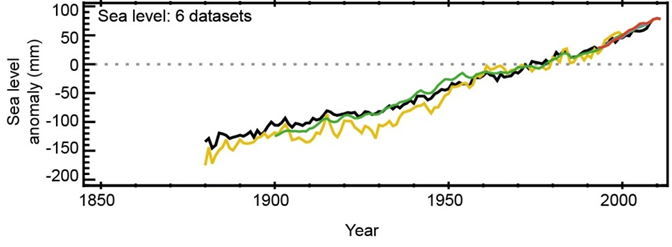
The IPCC assessed the relevant data carefully and concluded that sea level rose by around 19 cm (about 7 ½ inches) between 1901 and 2010. This is based on tide gauge data, with satellite data included after 1993. The rate of sea level rise was around 3.2 mm (about 1/8th inch) per year between 1993 and 2010. This is faster than the overall rate since 1901, indicating that sea level rise is accelerating as would be expected from thermal expansion of seawater and increased melting of ice on land.

Future sea level projections under the highest IPCC emissions scenario tell us what is likely to happen if emissions continue to rise unabated. In this case, sea level is projected to increase by a further 63 cm (about 24 ¾ inches) in the last two decades of this century compared with the 1986-2005 average.  Even in the lowest emissions scenario, which requires substantial emissions reductions, another 40 cm (about 15 ¾ inches) of sea level rise can be expected by 2100.


Read more in our Grantham Note on sea level rise.


Reference for figures:

IPCC, 2013: Climate Change 2013: The Physical Science Basis. Contribution of Working Group I to the Fifth Assessment Report of the Intergovernmental Panel on Climate Change [Stocker, T.F., D. Qin, G.-K. Plattner, M. Tignor, S.K. Allen, J. Boschung, A. Nauels, Y. Xia, V. Bex and P.M. Midgley (eds.)]. Cambridge University Press, Cambridge, United Kingdom and New York, NY, USA, 1535 pp.

7 Frightening Findings from the IPCC Report

By Helena Wright, Research Postgraduate, Centre for Environmental Policy

Helena Wright, an Imperial PhD student, looks at worst possible scenarios from the IPCC Working Group II report.cracked-earth

The United Nations’ Intergovernmental Panel on Climate Change (IPCC) recently released its latest report, featuring the most up-to-date science on global climate change.

As a researcher, I had an opportunity to contribute to a table in one of the chapters and have read through each of the 30 chapters of the Working Group II report (on Impacts, Adaptation, and Vulnerability).  Here is my personal take on seven of the most frightening findings from the WG2 report:

  1. CO2 levels of 1000ppm could impact on mental performance

The health chapter explains how climate change will affect global health, including direct impacts of heat stress, drought and extreme events, as well as indirect impacts on nutrition and mental health.

One extremely frightening direct effect could actually be from CO2 itself. A recent study found indoor  COlevels of 1000ppm (parts per million) can impair human decision-making performance and cognition.  Current atmospheric levels are 400ppm and rising fast.  Some scenarios have us reaching these levels by 2100. If these effects are confirmed, how will we be able to adapt?


  1. Climate stress affects children

One particularly frightening aspect of climate change is its impact on children.  This is a long term problem with implications for future generations.

Also, children, young people and the elderly are at increased risk of climate-related injury and illness. One study in Nepal found flood-related mortality was twice as high for girls as for women, and was higher for boys than men. Children are more vulnerable to impacts like malaria and diarrhoea for physiological reasons, and also more vulnerable to heat stress.


  1. Coral reefs would degrade under 2 degrees of warming

The coastal chapter explains carbonate reef structures would degrade under a scenario of 2°C by 2050-2100.  Increasing levels of  atmospheric  CO2 also cause the ocean to acidify, causing coral reefs to lose their structural integrity.  The North Atlantic and North Pacific are already becoming more acidic.

Coral reefs are important for biodiversity and account for 20-25% of fish caught in developing countries, as well as housing many other marine creatures.  Skeletal “dissolution” is expected to be widespread by 2100. The most frightening thing of all is that these are the impacts under business-as-usual scenarios.  Average global temperature has already risen by 0.8°C since 1880. Global leaders have only agreed to limit warming to 2°C of warming, a target they are currently missing.


  1. Climate extremes threaten our food security

Over 70% of agriculture is rain-fed, so agriculture and food security are highly sensitive to changes in rainfall.  Higher temperatures have an impact on crop yields.  Climate change will affect rivers and oceans as well. Some scenarios forecast widespread fish extinctions in rivers. In one study where data was available, as much as 75% of local fish biodiversity would be ‘headed toward extinction’ by 2070 due to climate change, particularly in tropical areas.

Food price rises triggered by climate shocks disproportionately affect the poor who tend to spend a higher proportion of their income on food.


  1. Global trade will be affected

Climate change will impact on international trade in both physical and value terms. For example, coffee is a major traded beverage which is sensitive to climate variability. Coffee crops will be forced to move to higher altitudes where they are available. Millions of rural people rely on coffee, tea and cocoa production.

The economic costs are expected to be huge.  For example, in Ethiopia, agricultural decline is projected to cause a 10% decline in GDP against benchmark levels.  While trade can help countries to adapt, for example by importing food, deficits may have to be met by food aid.


  1. Climate change will impact on migration, and could lead to conflict and even wars

High food prices can impact on socio-political stability.  For example, 14 countries in Africa experienced food riots in 2008 during the 2008-9 price spike.

People can also be displaced by extreme weather events. But migrants do not necessarily reach safety; with new migrants more at risk at destinations in cities. Sea level rise is projected to lead to permanent displacement as coastal areas become uninhabitable.   Under 2 metres of sea level rise, 187 million people are expected to be displaced.

Chapter 12 also examines research on links between climate change and armed conflict. Many of the factors that increase the risk of civil war are sensitive to climate change. US Military experts recently called climate change “a catalyst for conflict”.


  1. There are limits to adaptation

Finally, there are limits to adaptation.  This means we cannot adapt to many of these impacts. For example, 31 Native Alaskan villages are facing “imminent threats” due to coastal erosion and several decided to relocate – but their ability to relocate also depends on financial support.  Examples of ‘hard’ limits to adaptation include water supply in fossil aquifers, limits to retreat on islands, and loss of genetic diversity.  In such cases climate change will lead to irreversible losses.

There are various ‘tipping points’ in the earth system which, if crossed, could trigger rapid and catastrophic climate change. Only mitigation can avoid such risks.  Unfortunately little is known about where exactly these ‘thresholds’ lie, making the risks even more difficult to manage.

The limits to adaptation explain why global emission reduction is so vital for humanity.  3-4 degrees of warming would be much more difficult to adapt to than 2 degrees to and could result in the collapse of systems. Yet current climate pledges leave us heading to a world 3.7 degrees warmer.  The IPCC shows global emissions are still rising rapidly and show no signs of stabilising.  We are entering a radically different world.

However, there are reasons for hope. The UNFCCC negotiations took place again last month in Bonn, with the aim of reaching a global climate deal. There are signs of leadership from the US and China, the worlds’ two biggest emitters, offering renewed hope that collectively we can tackle this problem.

Stranding our fossil assets or stranding the planet

By Helena Wright, Research Postgraduate, Centre for Environmental Policy

Earlier this month Carbon Tracker came to Imperial College London to discuss their report on ‘Unburnable Carbon’.  The report outlines research which shows between 60-80% of coal, oil and gas reserves of publicly listed companies are ‘unburnable’ if the world is to have a chance of keeping global warming below the globally-agreed limit of 2°C.  The event was followed by a lively debate.

The research, led by the Grantham Research Institute at LSE and the Carbon Tracker Initiative, outlines the thesis that a ‘carbon bubble’ exists in the stock market, as companies with largely ‘unburnable’ fossil fuel reserves are being overvalued.

In fact, the OECD Secretary-General Angel Gurria recently said:

“The looming choice may be either stranding those [high carbon] assets or stranding the planet.”

Digging a hole: ever deeper extraction, ever higher risks

The report found that despite these systemic risks, companies spent $674 billion last year to find and ‘prove’ new fossil fuel reserves.  Capital expenditure has been increasing, while production has been decreasing, with reserves ever harder-to-reach.

Companies like Exxon and Shell have been spending record sums trying to prove reserves, that ultimately risk being stranded in future. The research by Carbon Tracker suggests this is a faulty business model, and in fact risks inflating the ‘carbon bubble’.

If these high levels of capital expenditure continue, we will see over $6 trillion allocated to developing fossil fuel supplies over the next decade – a huge sum of wasted capital.  Luke Sassams outlined evidence that some companies are now starting to pick up on this and rein in their CAPEX spending.

Investors and regulators are now picking up on the issue.  A Parliamentary Report on the ‘carbon bubble’ was released last week, and Chair of the House of Commons EAC, Joan Walley MP, said: “The UK Government and Bank of England must not be complacent about the risks of carbon exposure in the world economy”.

Carbon Entanglement: Getting out of the bubble

One issue that has been highlighted is the fact that some OECD governments receive rents and revenue streams from fossil fuels.  There is also a policy and credibility issue.  If businesses do not believe governments are serious about tackling climate change, they may carry on investing in fossil fuels and perpetuate the entanglement.

It seems that investors are currently backing a dying horse. But continued expenditure on finding new fossil fuel reserves might also be testament to the failures of recent climate policy.

Some have argued the ‘carbon bubble’ thesis relies on the assumption that governments will act on climate change. But arguably, there is not a question of ‘whether’ this government regulation will happen, but merely a matter of ‘when’.   There is a systemic financial risk to fossil assets, whether the necessary government regulation happens pre-emptively, or as a result of severe climatic disruption.

In the discussion that followed, the audience discussed whether the ‘carbon bubble’ will actually burst, and several participants suggested it was likely to burst unless it is deflated in a measured way. An audience member asked: “Don’t the investors have the information already?” and various participants felt they do not, demonstrating the need for enhanced disclosure on carbon risk.

Finally, the discussion turned to institutional investors who are investing in fossil fuels.  Some commentators recognise the irony.  How can a pension fund claim to be helping pensioners, while potentially risking the lives of their grandchildren?  It has also been found that several universities invest in fossil fuels, including Imperial College, sparking a recent petition. The risks of climate change highlighted in the recently released IPCC AR5 report, are driving calls for all types of investors to recognise the risks of high carbon investment.

2014 – A pivotal year for CCS?

By Dr Niall Mac Dowell, Centre for Environmental Policy

For centuries, all of the world’s economies have been underpinned by fossil fuels.  Historically, this has primarily been oil and coal, but since the mid-1980s natural gas has become increasingly important. Over the course of the last decades, there has been an increasing focus on electricity generation from renewable sources, and since about 1990 carbon capture and storage (CCS) has become an important part of the conversation around the mitigation of our greenhouse gas (GHG) emissions.

The role of CCS in addressing our GHG mitigation targets is clear and unambiguous – see for example the IEA CCS technology roadmaps which show that by 2050, almost 8 GtCO2/yr needs to be sequestered via CCS; a cumulative of 120 GtCO2 in the period from 2015 to 2050. Tellingly, this means that we need to see real action on the commercial scale deployment of CCS globally by 2015 such that we have at least 30 installations around the world actively capturing and sequestering CO2 from a range of industrial and power-generation plants. Currently, there are 8 CCS projects around the world which are actively capturing and sequestering CO2 – primarily in North America (Shute Creek, Val Verde, Enid Fertilizer and Century Plant in the US and the Weyburn-Midale project in Canada) and Europe (Sleipner and Snøhvit in Norway), although Algeria have also been operating the In Salah project since 2004.

However, it is notable that none of these plants are capturing CO2 emitted from power stations; rather they are capturing from industrial sources from which CO2 arises in a stream suitable for transport and storage. This is particularly important as CO2 emissions from power generation represent the single largest source of global emissions.

For this reason, it is particularly encouraging to note the UK’s leadership position in this area. Following from our signing into law the mandate to mitigate by 80% our GHG emissions by 2050, the Department of Energy and Climate Change (DECC) have recently signed agreements for Front End Engineering Design (FEED) studies for two commercial scale CCS projects; the Peterhead project and the White Rose project.

These are two really exciting projects, both of which represent real world firsts. The Peterhead project is a collaboration between Shell and SSE and is a retrofit of post-combustion capture plant to an existing power plant. This project is intended to operate in a base-load fashion and follows on from the Boundary Dam CCS project in Canada which also uses Shell technology. However, a key distinction between the Boundary Dam and Peterhead projects is the CO2 source; Boundary Dam is a coal-fired power plant whereas Peterhead is a gas-fired power plants. From an engineering perspective, these plants present significantly distinct CCS challenges, and therefore the Peterhead project represents a real step forward.

It is, of course, important to emphasise the importance of the Boundary Dam project. Returning to the IEA’s CCS technology roadmaps, we can see that CCS on coal-fired power plants is of vital global importance; potentially contributing to about 40% of emission mitigation in both OECD and non-OECD countries.

The White Rose project on the other hand is an example of oxy-combustion technology applied to a coal-fired power plant. This project is a collaboration between Alstom, Drax Power and BOC. Here, instead of performing a retrofit, the White Rose project is building a brand new, state-of-the-art 450MWe super-critical power plant which has the capacity to co-fire biomass and coal which, when combined with CCS can lead to the plant producing carbon negative electricity. Importantly, the White Rose plant will have an emphasis on the generation of flexible power; something which is key as we have more and more intermittent renewable energy in our energy system.

Thus, 2014 is the year where CCS on power generation becomes a reality. Given the fact that fossil fuels will remain a vital part of the world’s energy landscape for some time to come, with some sources indicating that they will account for over 66% of the world’s energy by 2100, it is almost impossible to over emphasise the importance of our ability to utilise them in an environmentally benign and sustainable way. For this reason, I believe 2014 represents a pivotal year; one which, in time, we will look back on as being the dawn of the age of sustainable fossil fuels.

Workshop on climate science needed to support robust adaptation decisions

By Dr Simon Buckle

I just wanted to highlight the great event we held last week with Judy Curry at Georgia Tech on how we can use climate science to help us make better decisions – in business, government, health and development.  Do have a look at the presentations from the really diverse group we managed to assemble in Atlanta, from international organisations, business, development agencies, NGOs and research.

A few  points strike me as worth (re)emphasising:

  • Climate models are extremely valuable tools for assessing climate change over the rest of this century, but even the most advanced climate models are not yet able to provide detailed information with sufficient confidence on the variability and change of regional climate in the next few decades. This will take time and money (higher resolution, more computational power).
  • So trying to forecast the climate in 5, 10 or 20 years time is right at the research frontier, but many decision makers aren’t as hung up over the uncertainties in climate projections as the scientists.  They’re used to dealing with uncertainty and some of the factors they need to take into account are way more uncertain than how the climate will change;
  • It’s the holistic view of risk that matters. In other words, how climate variability and change interacts with other factors such as population, urbanisation, economic growth, degradation of ecosystems, land use change etc;
  • Scientists working on decision relevant issues need to think really hard about the decision making context.  Who is making decisions? What is the motivation? What is being decided and what are the relevant timescales? And are the research methods and outputs relevant and informative? Are there alternative approaches that might increase the robustness of decision making in the face of uncertainty? Are the limitations of the research transparent to the decision makers who might use it?
  • Many different approaches are emerging from collaboration among decision makers and scientists that can supplement the valuable insights gleaned from climate models and help inform robust decision making in the face of climate variability and change.
  • Even if some prominent UK politicians still have their heads in the sand over climate risks, major businesses, governments and development organisations are already factoring climate into their decision making.

You can read a more detailed summary of the workshop on the Grantham Institute website.

Climate change and health risks – new commission launched

By Siân Williams, Research postgraduate, Department of Physics and Grantham Institute for Climate Change

healthv3
Georgina Mace and other panelists at the UCL Institute of Global Health event on 16 January. Photo: S. Williams

In 2009 a joint report between University College London and The Lancet stated, “Climate change is the biggest risk to global health of the 21st century”. The work highlighted extreme weather events, changing patterns of disease and food and water insecurity.

Now a second UCL-Lancet commission is underway. Last month, UCL’s Institute of Global Health hosted a launch event for the report entitled ‘Climate crisis: emergency actions to protect human health’.

The event was chaired by UCL’s Anthony Costello, head of the first Lancet commission. Panellists involved in the new commission include scientists and economists from UCL, Tsinghua University in Beijing and the Stockholm Resilience Centre.

The new commission is structured with five working groups. Its aims range from drawing out the key implications of the IPCC’s Fifth Assessment Report on health through to assessing the financial and policy mechanisms available to governments to protect their citizens against the worst impacts of climate change.

The format of the event allowed a wide range of issues to be discussed. These included the impacts of climate on mental health and the disillusion felt by many towards the COP international climate negotiation process.

Isobel Braithwaite, from the student-led Healthy Planet organisation, commented that “The first UCL-Lancet commission really served to shift the discussion away from climate change being just about ice caps and polar bears to an issue that’s ultimately about people’s health, so it’s exciting to hear that a second commission’s now underway. It sounds like this second one will go into much more depth on the actions we need to take to avert the major health crisis posed by unmitigated climate change”.

At the most recent COP negotiations in Warsaw, Healthy Planet formed part of the protest movement against Poland’s plans for future coal plants. The topic of climate and health will continue to be in the spotlight during Health Planet’s national conference, which will take place over the first weekend of March. Tickets for the event are available here.

Updates to the IPCC WG1 Summary for Policy Makers

By Dr Flora MacTavish

The IPCC has released corrected figures for past carbon dioxide emissions and future emissions trajectories quoted in the Summary for Policy Makers of the Working Group 1 report, “Climate Change 2013: The Physical Science Basis”.  The original numbers were published in the report released on 27th September, which was subject to copy edit and final layout changes.

In total, six values from the summary have been changed. As noted by Professor Sir Brian Hoskins, Director of the Grantham Institute, these corrections are minor adjustments to historical greenhouse gas emissions and to the cumulative emissions consistent with achieving a 2 degree warming target with different levels of probability.  The 2 degree target is significant because it forms the basis of international climate change negotiations. These minor corrections do not affect any of the conclusions drawn in the Summary for Policy Makers.

Since the IPCC did not do so, I have produced the following table to compare the new values to the original values for all the parameters that have changed. For each parameter, the difference between the original best estimate and the new best estimate is given in the right hand column. This is also expressed as a percentage of the original value.  As can easily be seen, the changes in the parameters are all relatively small compared to the values of those parameters. Most are also small compared to the 90% uncertainty interval (range) given.

If you are unable to read the table below you can also view it here.

Section of the SPM affected Parameter changed Value given in the version released on 27th Sep 2013 (gigatonnes of carbon, GtC) New values, released 11th November  2013 (all in gigatonnes of carbon, GtC) Comment
Section B.5, bullet 4 Cumulative CO2 emissions from fossil fuel combustion and cement production over the period 1750 to 2011. 365 [335 to 395] 375 [345 to 405] The best estimate and range revised upwards by 10 GtC, an increase of 2.7% in the best estimate.
Section B.5, bullet 4 Cumulative anthropogenic CO2 emissions over the period 1750 to 2011. 545 [460 to 630]  555 [470 to 640] Best estimate and range revised upwards by 10 GtC, an increase of 1.8% in the best estimate.
Section B.5, bullet 5 The accumulation of carbon from anthropogenic CO2 emissions in natural terrestrial ecosystems over the period 1750 to 2011. 150 [60 to 240] 160 [70 to 250] Best estimate and range revised upwards by 10 GtC, an increase of 6.7% in the best estimate.
Section E.8, bullet 2 Total cumulative CO2 emissions from all anthropogenic sources to limit warming to less than 2°C (from CO2 alone) since the period 1861–1880 with a probability of >33%. 0 to 1560 0 to 1570 The maximum value was revised upwards by 10 GtC, a percentage increase of 0.64%.
Section E.8, bullet 2 The maximum cumulative CO2 emissions from all anthropogenic sources for limiting warming to less than 2°C (including non-CO2 forcing as in RCP2.6 – the lowest emissions scenario used by the IPCC) listed for probabilities of >33%, >50%, and >66%. 880, 840 and 800  900, 820 and 790 Numbers changed by +20, -20 and -10 GtC. The percentage changes were +2.3%, -2.4% and -1.3%.
Section E.8, bullet 2 Cumulative anthropogenic CO2 emissions over the period 1870 to 2011. 531 [446 to 616] 515 [445 to 585] Best estimate reduced by 16 GtC, a decrease of 3%. Range also reduced from 170 to 140 GtC.