New blog address
The Climate and Environment at Imperial blog has moved. Visit our new blog.
The Climate and Environment at Imperial blog has moved. Visit our new blog.
This blog post is part of a series on Responding to Environmental Change event, organised by the Natural Environment Research Council (NERC) funded Doctoral Training Partnerships at Imperial (SSCP), and the University of Reading and the University of Surrey (SCENARIO).
A recent event in London brought together emerging environmental scientists (PhD students and early career researchers) with leaders from business, policy and academia to explore the challenges posed by environmental change and opportunities to work in collaboration to respond to these.
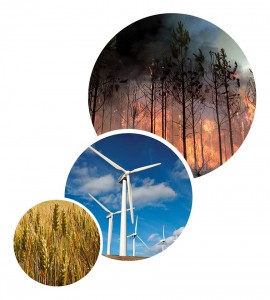
Communities today find themselves and the environments they live in under increasing pressure. This is driven by growing populations, urban expansion and improving living standards that place increasing stress on natural resources. Added to this is the rising threat from environmental hazards and environmental change.
Research, development and innovation within the environmental sciences and beyond offers the opportunity to manage these pressures and risks, exploring how we can live sustainably with environmental change, whatever its drivers.
Discussion at the event covered three key societal challenges and their implications for business and policy. A summary of these talks has been captured by students attending the event and can be found below.
The event was organised by the Natural Environment Research Council (NERC) funded Doctoral Training Partnerships at Imperial (SSCP), and the University of Reading and the University of Surrey (SCENARIO).
Natural resources are fundamental for wellbeing, economic growth and sustaining life. Greater demand for food, water and energy requires better management and use to reduce stress on natural systems and ensure a sustainable future.
Read more in a report by Jonathan Bosch, a first year SSCP PhD student researching transitions to low-carbon energy systems.
Environmental hazards are becoming more frequent and severe, with potentially serious impacts on people, supply chains and infrastructure globally. Advancing our knowledge and understanding of these hazards, and the processes involved, will allow us to better predict, plan for and manage the risks in order to increase resilience to these changes.
Read more in the report by Malcom Graham, a first year SSCP PhD student researching saline intrusion in coastal aquifers.
In addition to natural variability, human activities are causing rapid, large-scale climate and environmental change. Understanding how these processes work as a whole Earth system can improve our understanding of the impacts of these changes and inform responsible management of the environment.
Read more in a report by Rebecca Emerton, a first year SCENARIO PhD student researching approaches to global forecasting of flood risk.
Matthew Bell, Chief Executive at the Committee on Climate Change, concluded the event with a talk on the road to Paris and the issues that could be faced in the climate negotiations.
Read more in a report by Samantha Buzzard, a third year NERC PhD student at Reading investigating the role of surface melt in the retreat and disintegration of Antarctic ice shelves.
Watch videos of all the talks on our YouTube channel.
Find out more about the Science and Solutions for a Changing Planet DTP at Imperial College London.
Find out more about the SCENARIO DTP at the University of Reading and University of Surrey.
This blog post by Malcom Graham, an SSCP DTP student, is part of a series on Responding to Environmental Change, an event organised by the Natural Environment Research Council (NERC) funded Doctoral Training Partnerships at Imperial (SSCP), and the University of Reading and the University of Surrey (SCENARIO).
See the full list of blogs in this series here.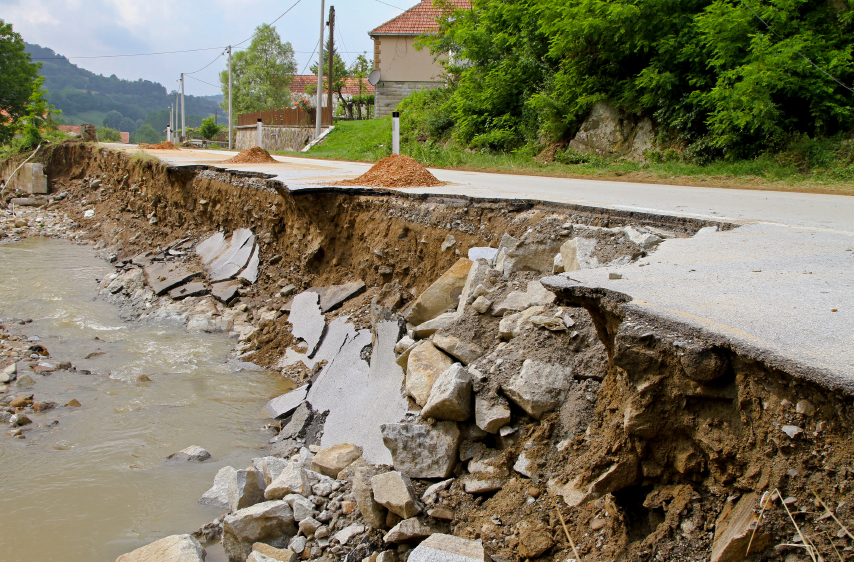
Environmental hazards are becoming more frequent and severe, with potentially serious impacts on people, supply chains and infrastructure globally. Advancing our knowledge and understanding of these hazards, and the processes involved, will allow us to better predict, plan for and manage the risks in order to increase resilience to these changes.
This session focussed offered perspectives from academia (Imperial College London), the world of (re)insurance (Willis Re) and the charity sector (Oxfam).
David Simmons, the Head of Strategic Capital and Result Management at Willis Re, began proceedings and impressed us by speaking with no slides or notes, describing it as a ‘liberating’ experience. Despite (or perhaps helped by) the absence of visual aids, his delivery was nevertheless engaging and humorous.
His talk focussed on the world of reinsurance, which he assured us was the ‘sexy’ part of the insurance sector, specialising as it does in catastrophe risk. He contrasted this with the banal nature of regular insurance work and the social death that ensues for most practitioners.
We were told that reinsurance, which covers the insurance companies themselves against major disasters, is suffering from too much capital. Stoically, David explained the reasons behind this: essentially, due to financial uncertainty in other sectors, no one else could offer the low risk and high returns on investment now commonplace in the reinsurance industry. This he attributed to a much greater understanding of catastrophe risk over the last few years than had previously existed.
Following on from Don Friedman’s modelling of hurricanes in the 1980s, which provided a basis for hazard and probability analysis, David explained how there has since been massive investment in producing ever more reliable models to understand these elements. Indeed, the process of developing models in itself seems to have driven the understanding of various components and allowed constraints to be placed on the ‘unknown unknowns’, a Rumsfeldism which seems to make its way into most talks on modelling these days.
The price of reinsurance has apparently dropped substantially in recent times, driven by the unprecedented levels of investment. In particular, we were told that reinsurance for many parts of the developing world comes at negligible cost, due in part to a reduction in the number of deaths from droughts as a result of more reliable aid. Although this is clearly a positive development, David was keen to point out that the arrival of aid was often too slow to prevent significant human suffering and damage to assets and infrastructure. The focus has therefore turned to more timely interventions and having better systems in place for disaster response.
We learnt that insurers are now playing an important role in driving best practice from governments, with many African countries having to present draft disaster response plans, audited reports on actual responses implemented by the government and the results of anti-corruption tests before they can join insurance programs.
David’s talk closed with commentary on the growth of various large-scale insurance schemes, many of them covering multiple countries. He cited the example of the African Risk Capacity, which is expanding from 5 to 10 members, and a scheme in the Caribbean which is now expanding into Latin America. He did highlight some pitfalls with the more inclusive approach to insurance, contrasting the approach to flood insurance in the UK, where higher risk properties pay an additional premium, with the French system where all households pay the same, thereby removing some of the incentive for individuals to reduce their risk.
Our second talk of the session came from Martin Rokitzki, former resilience advisor for climate change adaption at Oxfam. Humbly professing to be ‘the least scientific person in the room’, he could nevertheless point to 15 years of practical experience working on climate change and environmental issues.
His talk began by looking at what is actually meant by the term ‘resilience’, which appears to have numerous definitions relating to one’s ability to cope, adapt, prepare or thrive when faced with shocks, stresses or uncertainties.
When presented with such an uncertain framework, we were unsurprised to learn that there is no ‘cookie-cutter or cook-book’ for resilience and that the term may be applied to a huge range of social and economic groups. By talking about his experiences with Oxfam, Martin was at least able to narrow his focus to addressing the resilience of the world’s poor.
Even within this constraint, understanding hazards and impacts was presented as a multi-faceted exercise. Variations in the spatial extent of damage, its intensity, duration, rate of onset and level of predictability could all have profound effects on the planning process. Counterintuitively, Martin felt that slow-onset hazards were often the hardest to address and his talk focussed on how to deal with challenges of that nature, such as the East African food crisis, glacier melt in Nepal and salt intrusion in Tuvalu.
We were told that Oxfam’s approach to resilience involves 5 key areas: livelihood viability (i.e. the economic buffer to disaster); innovation potential; contingency resources and support access (i.e. provision of aid); integrity of the natural and built environment (in the case of the extreme poor, they are directly dependent on the surrounding natural environment); and social and institutional capacity (i.e. governance).
In contrast to the preceding speaker, Martin’s presentation abounded with eye-catching schematics, highlighting various approaches to disaster management. Key to these were the integration of policy and projects to get a successful outcome. To illustrate this, he presented us with the ‘Cycle of Drought Management’ which moves through stages of preparedness, disaster response and relief, reconstruction and mitigation. Alas, the paucity of data in 80-90% of affected areas means that the preparedness stage is often a huge challenge. Our presenter highlighted this as a key reason for Oxfam to collaborate more closely with scientists.
Towards the end of his talk, Martin touched on Oxfam’s R4 approach to risk, encompassing risk reduction (managing resources well), risk transfer (insurance), risk taking (credit for investment) and risk reserves (savings). Without this sort of strategy, seasonal food shortages could easily become year round famines. As part of this Oxfam has been helping to administer financial services in remote rural areas and developing a focus on flexible and forward-looking decision making.
Martin’s final message was that we need more collaboration between the ‘thinkers’ and the ‘doers’ – a clear call for the science community to engage more directly and more frequently with aid agencies and other environmental organisations.
Our final speaker of the session was Imperial’s very own Professor Ralf Toumi, who described his ongoing work on the OASIS project, an open access model for looking at the impacts of extreme weather events on the built environment.
His main driver for the project was the limited number of companies providing assessments of risk in this area, thereby giving a fairly narrow field of views on risk to the insurance sector. He reflected that this has not been helped by a continuing barrier of information between researchers and insurers and the ‘black box’ approach to disaster modelling which exists within the commercial world.
Following the previous speaker’s flurry of eye-catching diagrams, Ralf was not shy to present a few schematics of his own, illustrating the concepts behind OASIS. These highlighted the user’s ability to select combinations of models to give a tailor-made view of risk, including a broader spread of results and a greater understanding of model bias and uncertainty. To highlight the point, Ralf asserted that vulnerability modelling (i.e. the damage caused by an event) has a much greater level of uncertainty than hazard modelling. Indeed, one of the key challenges of the OASIS project has apparently been to get hold of datasets on damage, information which some players in the industry have been reluctant to provide.
A further challenge, we were told, is the effect of giving insurers greater experience in using this modelling framework: the desire for greater complexity. Whilst models appear to be ever more powerful (a 30 year dataset can apparently now be used to predict a 1 in 1000 year event!) there is a serious challenge to translate this complexity from the academic / journal environment to insurance professionals. There has also been a need to standardise the wide array of different data formats associated with OASIS’ component models.
Despite these challenges, it appears that OASIS is flourishing. Our presenter proudly displayed a series of media articles after their press release went viral, along with a list of 44 members of the OASIS Loss Modelling Framework, a list that includes numerous insurance and reinsurance companies. Their many associate members include a variety of government bodies, academic institutions and IT companies.
A combined question and answer session followed on the three presentations. It began with the question of how all these ‘big complex’ models have been validated with data. Professor Toumi agreed that validation is a huge issue, although hazard validation is much easier to do, using historical datasets, than validating predictions of damage, which sometimes diverge wildly. David Simmons was able to point to a recent paper he had written on model validation and highlighted that the non-stationary world we live in means that there are never sufficient data. Nevertheless, he believed that even non-validated models are better than nothing and that the modelling process aids understanding as much as the end result. He also highlighted that satellite datasets can act as a useful first-pass method for validating models.
The second question focussed on how we transition from looking at short-term resilience to combatting longer-term changes. Martin Rokitzki responded that although we live in a short-term world, transformative scenario planning is more commonly done nowadays, which is often based on narratives rather than data alone. Adaptive management is also more common.
Another audience member (currently working for one of the London mayoral candidates) wondered what question we should pose to mayoral candidates of large cities in relation to risk management and resilience. The panel were somewhat stumped by this, but (ironically) opted to answer the question about a question with another question: Martin Rokitzki wondered who has responsibility for risk management. Should adaptation be a government service, should it be borne by individuals or even by the private sector? David Simmons cited an example of the World Bank trying to cover industrial areas against earthquakes and reward good design through financial incentives. Unfortunately, the scheme struggled through a lack of political will to take decisions which might be unpopular with their electorates, despite having clear long-term benefits.
The final question related to the possible impacts of a catastrophic asteroid impact and the huge disparity between the insurance fund set aside to cover Florida’s coastline from storm damage and flooding ($2 trillion) compared to a much smaller sum assigned globally for larger-scale catastrophes like asteroid impacts ($0.5 trillion). David Simmons responded that the insurance industry focuses on the short-term, partly due to the 5 year tenure of most CEOs. This makes asteroid impacts beyond the timescale of concern. Another contributor to the disparity is that flood insurance is governed by a regulator in Florida. Despite this, David felt that Florida now has enough reinsurance capacity and that there is now a need to better understand hazards like asteroids.
And as we all dwelt on what sort of cosmic destruction may be in store, the session was brought to a close, leaving us with the much simpler conundrum of what to have for our lunch.
Watch a video of the talk on our YouTube channel.
This blog post by Rebecca Emerton, a Scenario DTP student at University of Reading, is part of a series on Responding to Environmental Change, an event organised by the Natural Environment Research Council (NERC) funded Doctoral Training Partnerships at Imperial (SSCP), and the University of Reading and the University of Surrey (SCENARIO).
See the full list of blogs in this series here.

In addition to natural variability, human activities are causing rapid, large-scale climate and environmental change. Understanding how these processes work as a whole Earth system can improve our understanding of the impacts of these changes and inform responsible management. One key challenge is how we monitor and record environmental data, and the role this data can play in managing the environment.
The third challenge area of the Responding to Environmental Change event explored the management of environmental change, including how environmental data is monitored and recorded, and challenges faced in utilising this data.
Jacquie Conway, Head of Institutional Relations UK within Airbus Defence and Space – Geo-Intelligence, opened the afternoon with a discussion of the practical applications of Earth Observation (EO) data. A key question was presented: “Why Space?”, highlighting the benefits of EO for providing evidence used to assess how much land change is occurring, where this land change is taking place and the causes and impacts of the change, alongside uses in model validation and determining possible future changes. Examples were given such as forest mapping and monitoring, in order to identify degradation and illegal logging, and the changes in these over time. Further examples include food security and crop sustainability – analysis of drought areas and possibilities for improved farming management practices, and urban planning through monitoring land use change and developing cities. Disaster management is also key, with EO data and mapping used in emergency response, recovery and preparation.
The challenges associated with EO and Big Data are continuously evolving, with increased volume, diversity and value of EO data, in conjunction with non-space data. Aspects such as quality, continuity, timeliness and uniqueness of data are significant in approaching the Big Data challenge. Emerging solutions include the Airbus Processing Cloud, which provides a platform for hosted processing, with examples given of completed successful processing and reprocessing campaigns. Where the previous data processing time for one mission was greater than 700 days, it is now possible to process this data in just 2 weeks through use of the Airbus Processing Cloud. Alongside data processing, the platform will enable development of new products and services through a partnership approach, with the intent to support SMEs, research organisations and Universities, among others.
Copernicus was introduced as the European Flagship Earth Observation Programme to monitor environmental change, by Jacquie Conway, and discussed further by Dr Farhana Amin (Defra). Copernicus is led by the EU and co-ordinated by the ESA, and is the European response to a global need to manage the environment, providing necessary data for operational monitoring of the environment, and for civil security. With a €3.8bn investment in Copernicus, 6 missions (each with 2 satellites) will be launched, resulting in up to 8TB of new, open access data on the environment, per day. These missions will provide valuable information for land, marine and atmosphere monitoring, alongside emergency management, security and climate change services.
Dr Amin gave a policy perspective on managing environmental change, highlighting the responsibilities of Defra for policy and regulation on environment, food and rural affairs, including the protection from floods and plant/animal diseases, alongside improving the environment and rural services. The statutory obligations of Defra range from monitoring pesticide residues on food, to managing natural resources through monitoring of air quality and biodiversity. Emphasis was placed on Evidence-Based Policy, using observations, knowledge and scientific research to provide the basis for all policies. Examples were given of current programmes such as Cefas – the Clean Seas Environment Monitoring Programme, which aims to detect long-term trends in the quality of the marine environment through collection of high quality, standardized data. Other examples include the monitoring of bathing water quality, and UK Surveillance Schemes involving partnerships between the Joint Nature Conservation Committee (JNCC), NGOs, research bodies and volunteers to monitor wintering and breeding birds, butterflies, bats, plants and other mammals.
Satellite applications also have a long history of use within Defra, for research and monitoring of land use, roads and marine environments, and GPS data for forestry monitoring, flood monitoring and field sample collections. Again, challenges with EO were discussed, such as the highly complex processes involved, the need for high quality data and regular analysis, working around multiple partners and methodologies, and the resource intensive nature of environmental monitoring.
Professor Anne Verhoef (University of Reading) provided a research perspective on managing environmental change, discussing steps towards an improved understanding and sustainable management of the ‘Critical Zone’ (CZ), which extends from groundwater reservoirs to soil, to the surface and lower atmosphere – in other words, the zone in which we live. The CZ affects food, water and energy resources, and plays a major role in our weather and (micro)climate, also allowing us to mitigate the effects of extreme events and environmental change. Advances in monitoring of the CZ at many time and space scales (for improved understanding and management), include novel monitoring of field-scale soil moisture and a wireless underground sensor network. Also on the theme of Earth Observation, imaging such as X-Ray CT imaging and remote sensing play a role in understanding and managing the CZ.
Another key aspect is modelling of the CZ, using various models to study part of, or the entire, CZ, such as land surface models (within global circulation models, e.g. JULES), groundwater models, and Soil-Vegetation-Atmosphere-Transfer (SVAT) models. SVAT models can further be coupled with remote sensing (EO) data of multiple types and at a range of spatio-temporal scales, leading to more generic tools for environmental research and management. Versatile tools exist allowing the calculation of crop yield, photosynthesis etc., such as the SCOPE model, which is an SVAT model supporting the direct interpretation of EO data. It was concluded that improving models to include more realism, and combining them with EO and remote sensing products, alongside the use of novel in-situ monitoring techniques (for improved ground data), will improve our understanding of the CZ and help move towards sustainable management of environmental change.
Both the similarities and differences between the perspectives from business, policy and research, and the challenges faced in using EO data for the management of environmental change, show the benefits of collaboration and partnerships, alongside the advances and extensive work towards sustainable management of the changing environment.
Watch a video of the talk on our YouTube channel.
by Professor Martin Siegert, Co-director, Grantham Institute
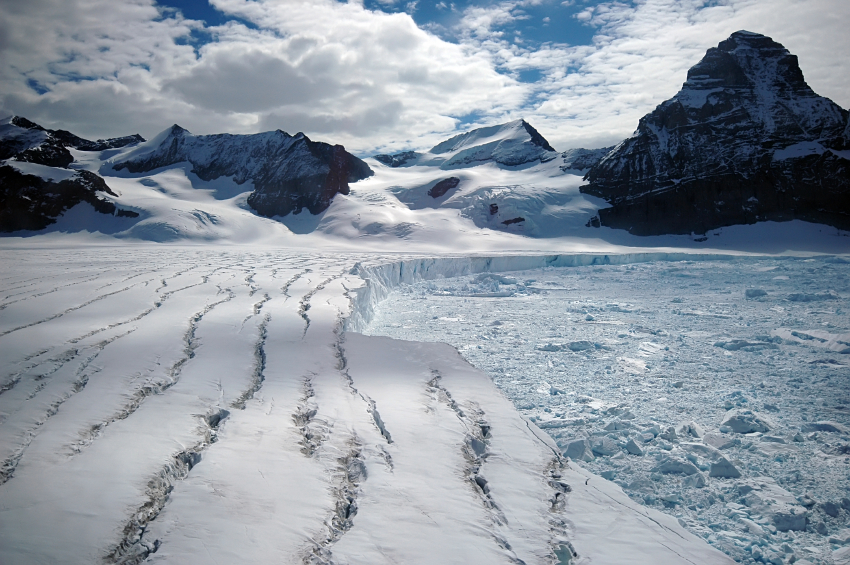 On 27th October I convened a meeting at the Royal Society of London to discuss the results of a recent 20-year research horizon scanning exercise for Antarctic Science (Kennicutt et al. 2014). Part of the discussion focused on the research needed to better quantify Antarctica’s likely contribution to sea level rise in the coming decades and beyond, as published in the new Intergovernmental Panel on Climate Change (IPCC) Synthesis Report.
The report states that, ‘Global mean sea level rise will continue during the 21st century, very likely at a faster rate than observed from 1971 to 2010, and will likely be in the ranges of 0.26 to 0.55 m [in the lowest emissions scenario] … and … 0.45 to 0.82 m [in the highest emissions scenario – the closest to “business as usual”]’. It also states that, ‘Based on current understanding, only the collapse of marine-based sectors of the Antarctic ice sheet, if initiated, could cause global mean sea level to rise substantially above the likely range during the 21st century.’ There is medium confidence that any additional sea level rise would be no more than tens of centimetres.
One of the speakers at the event, Prof. David Vaughan, the Director of Research at the British Antarctic Survey, supported the IPCC’s position by remarking that he knew of no glaciologist who would strongly advocate a different position to this, given the evidence at hand. As a glaciologist myself, I can easily accept Prof. Vaughan’s comment and I don’t believe it is controversial among the community. I was, however, provoked by it to consider the relevant issues a little further, given the uncertainties noted by the IPCC, and to take the opportunity to discuss it with colleagues at the meeting.
Historically, ice sheet responses to global warming have been responsible for sea level changes of a metre or more per century. As the glaciers retreated after the last ice age, sea levels rose by an average of over a metre per century between 20,000 years ago and 10,000 years ago – a total of 120 m. Records also show that the rate of sea level rise can exceed this, however. During the so-called ‘meltwater pulse 1a’ (MWP1a) episode around 15,000 years ago, an increase of around 7 m per century took place. The cause of MWP1a remains uncertain, with some pointing to the rapid decay of the North American ice sheet, whereas others link the change to Antarctica. It may be that both ice sheets were involved to some degree, and the details of the issue remain hotly debated. The point to note is that changes in the cryosphere are certainly capable of causing global sea level to rise at a higher rate than the IPCC suggests.
It is worth considering whether we can rule out the possibility of a new meltwater pulse being locked in somewhere in Antarctica or Greenland, ready to be released to the ocean once some threshold has been reached. As the IPCC notes, several regions of the West Antarctic ice sheet (in particular) and East Antarctic ice sheet appear close to or at a physical threshold of change, where ground ice retreat into deeper (below sea level) terrain leads to further accelerated loss of ice to the sea (often referred to as marine ice sheet instability). Papers earlier this year by Joughin et al. (2014) and Rignot et al. (2014) point to such irreversible change having already begun in the Amundsen Bay region of West Antarctica. According to Joughin et al. (2014) the full effects of such change may take several hundred years, in line with the IPCC’s position. Evidence from the other side of West Antarctica demonstrates a region the size of Wales being highly sensitive to future ocean warming (Ross et al. 2012), and that such warmth may be delivered within a few decades (Hellmer et al. 2012). Across the continent in East Antarctica, the structure of the underlying bedrock reveals evidence of major ice recession in the past (Young et al. 2011), hinting that the ice sheet response to warming is not necessarily restricted to West Antarctica. Indeed while West Antarctica may be losing mass more quickly than anywhere else on the planet, the greatest potential for sea level change lies in East Antarctica, which about ten times greater in volume.
So, after considering Prof. Vaughan’s point that no glaciologist would differ markedly from the IPCC on Antarctic ice sheet collapse, I returned a question to him and those gathered: how can we be sure that the Antarctic ice sheet won’t respond to ocean warming more quickly than expected in certain regions? The answer is we can’t be certain even though, like Joughin et al. (2014), we may consider it unlikely. While I did not dispute Prof. Vaughan’s point, in the light of both recent findings and more established figures on how ice sheets can change during episodes of global warming, there is surely a non-zero risk of much greater sea level rise over the coming decades than the IPCC alludes to.
Quantifying this risk is difficult – maybe impossible at present – and as a consequence is likely to be highly controversial, which is why the IPCC does not tackle it. The problem is that quantifying a non-zero risk of global sea level rise over 1 m in the next 100 years is a far more challenging problem – for both scientists and decision makers – than restricting the debate to what we consider most likely. Maintaining this restriction on the debate is neither safe nor sensible, however.
Glaciologists will point to the research needed on the Antarctic ice sheet’s sensitivity to ocean warming to advance the debate. In 20 years as a glaciologist, I have been surprised on numerous occasions by what we discover about the flow and form of past and present ice sheets. I am utterly certain that amazing new discoveries lie ahead. For this reason, an appropriately sceptical scientific attitude is to accept that our knowledge of Antarctica remains woefully inadequate to be certain about future sea level rise, and to always challenge the consensus constructively.
The solution lies in our ability to model the ice-ocean system in a way that allows confident predictions of the ice sheet response to ocean warming. To do this we need two things. First is better input data, by way of high-precision landscaping beneath the ice sheet in regions most sensitive to change, and in areas where no data have been collected (and there are several completely unexplored parts of the continent). The data collected would also allow us to better understand the process of ice flow in key regions of potential change. A second advance needed is in the coupling of ice-sheet and ocean models. Both are challenging, but well within our abilities to achieve them. Indeed the horizon scanning exercise discussed last week made such investigations a priority.
The Climate and Environment at Imperial blog has moved. View this post on our new blog
By Dr Flora Whitmarsh, Grantham Institute
The recent slowdown in global temperature rise has led to suggestions that global warming has stopped. In fact, the Earth system is still gaining heat, and the slowdown was likely caused by a series of small volcanic eruptions, a downward trend in the solar cycle, and increased heat uptake of the ocean. Writing in the Telegraph, Christopher Booker claims that a new paper by Professor Carl Wunsch (Wunsch, 2014) shows that ocean warming cannot explain the slowdown because the deeper ocean is in fact cooling rather than warming. Booker is incorrect in his interpretation of the paper, as Professor Wunsch explained in a letter of response to the Telegraph editor that was not published. Wunsch also wrote a letter to the editor of The Australian following a similarly misleading article in that newspaper. There are two threads to Christopher Booker’s argument in the Telegraph article. First, he suggests that the new paper refutes the idea that the pause is caused by an increase in ocean heat uptake, an interpretation that is untrue. Second, Booker gives a misleading interpretation of Wunsch’s appearance on the 2007 television documentary The Great Global warming Swindle in which Wunsch’s views were misrepresented by the documentary makers. Below, I describe the significance of ocean heat uptake and then discuss Booker’s two points in turn.
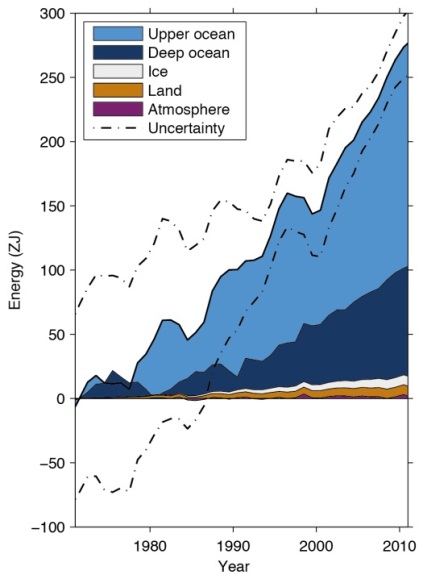
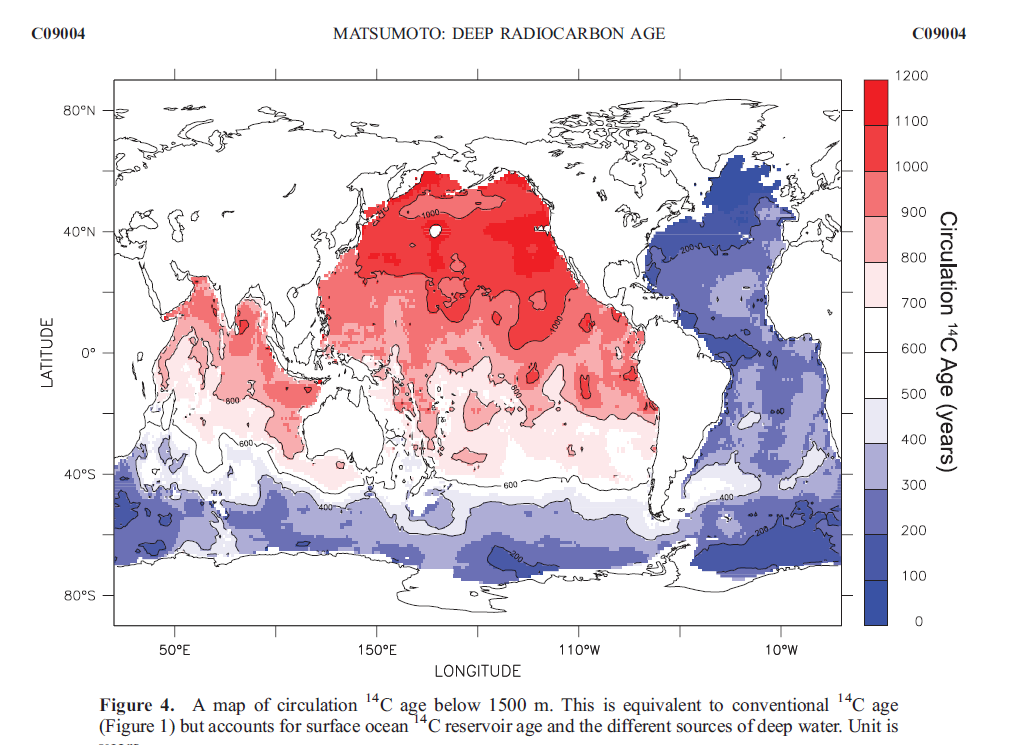
The ocean is an important heat sink and has taken up over 90% of the extra heat absorbed by the Earth system over the last century. There is natural variation in the amount of heat being taken up by the ocean. This is part of the reason why the observed increase in surface temperatures has not been uniform in the past. All studies including this latest one agree that the ocean above 2000 m is absorbing a significant amount of heat and this is the main focus of studies trying to detect and attribute global warming. The study of the ocean below 2000m is interesting from a scientific point of view but is less relevant to the study of climate change because it takes a very long time for heat to mix to these lower layers. Heat is transferred to the deep ocean by the movement of water masses – the mixing driven by the small-scale movement of water molecules is too slow to be of much significance. Due to the locations of the major ocean currents, parts of the deep ocean such as the western Atlantic and the Southern Ocean in the Antarctic have been in contact with the surface relatively recently, meaning they would be expected to have warmed due to global warming. By contrast, much of the Pacific Ocean below 1500 m has not been in contact with the surface for around a thousand years – something that has been demonstrated by studying the radioactive decay of carbon-14 atoms in a technique similar to the carbon dating of objects (Matsumoto, 2007 – see figure 2).
Christopher Booker writes, “Prof Carl Wunsch … has produced a paper suggesting not only that the warmists have no real evidence to support their claim other than computer modelling, but that the deeper levels of the oceans have, if anything, not been warming but cooling recently, thanks to climate changes dating back centuries.”
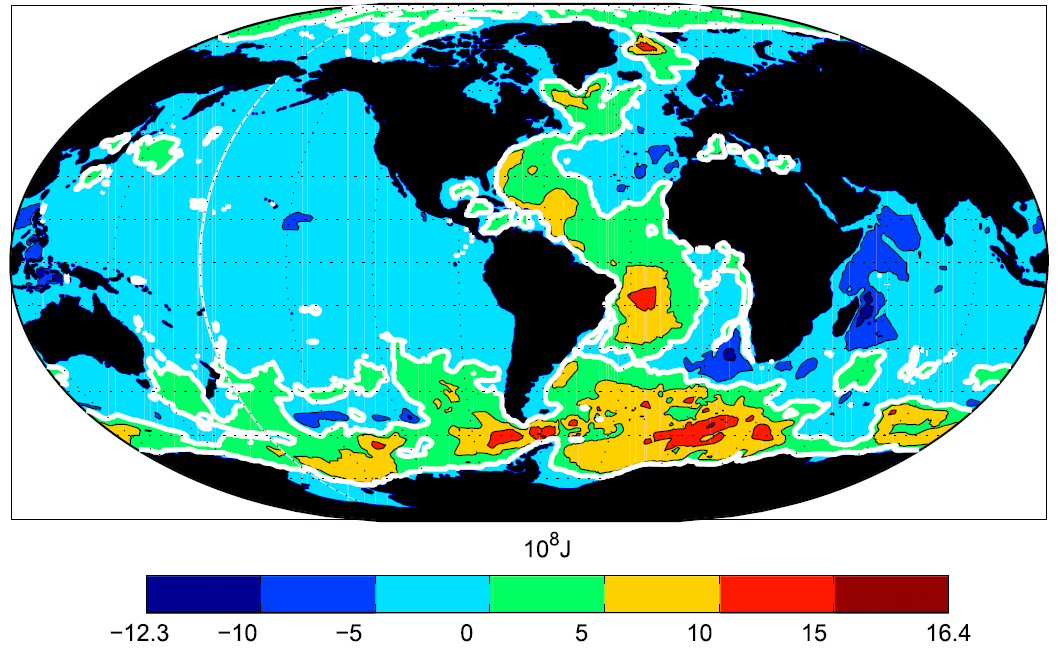
In the paper under discussion, Bidecadal Thermal Changes in the Abyssal Ocean, Wunsch looks at observations of ocean heat content. He found that the ocean as a whole and the top 700 m had gained heat since 1993, but that there had been an overall decline in heat content below 2000 m according to the available data. There has been a warming in the regions of the deep ocean below 2000 m where it would be expected due to the transport of water from the surface to the abyss by major ocean currents, i.e. the western Atlantic Ocean and the Southern Ocean (see figure 3). There was an observed cooling below 2000 m in other parts of the ocean including most of the Pacific. Much of the deep Pacific Ocean would not be expected to have warmed due to climate change because the water has not been in recent contact with the surface (figure 2). The available observations are very sparse and only about a third of the water below 2000 m was sampled at all during the period under discussion, meaning it is not known whether these results reflect a genuine cooling below 2000 m. Because there was heating in some places and cooling in others, it is particularly hard to accurately determine the mean from very sparse observations. The main conclusion of Wunsch, 2014 was in fact that more observations are needed to improve our understanding of processes involved in transporting water to the deep ocean. This is a subject which has received relatively little attention, with much more research effort being concentrated on the upper ocean. It is likely that this is partially due to the difficulty involved in observing the ocean at depth, and partly because the upper ocean is of interest due to its direct impact on weather patterns, for example through its role in the formation of El Niño and La Niña conditions. None of this changes the fact that the Earth system as whole is gaining heat, and that a significant proportion of that heat is being taken up by the ocean, mostly in the top 700 m. The paper doesn’t significantly change our understanding of the pause in surface temperature rise. We know that natural processes do change the amount of heat taken up by the ocean over time, and that surface temperature rise has not been uniform in the past. However, precisely quantifying how much heat has been taken up by the deep ocean is still not possible with current observations.
Referring to the 2007 television documentary, The Great Global Warming Swindle, Booker suggested that Wunsch had privately held “sceptic” views at the time the programme was aired, but didn’t feel able to express these views in public, “So anxious is the professor not to be seen as a “climate sceptic” that, [after being interviewed for] The Great Global Warming Swindle, he complained to Ofcom that, although he had said all those things he was shown as saying, he hadn’t been told that the programme would be dedicated to explaining the scientific case against global warming.” Professor Wunsch’s views on The Great Global Warming Swindle are explained at length on his professional webpage in an article dated March 2007. I will not paraphrase his comments in detail, but suffice it to say he states his belief that “climate change is real, a major threat, and almost surely has a major human-induced component”, and wrote to the documentary makers to say, “I am the one who was swindled” because they misrepresented his views by quoting him out of context. In an update written three months later, Wunsch made it clear that he did not complain to Ofcom under duress from other scientists. In fact, he felt so strongly that his opinions had been misrepresented that he filed his complaint despite threats by the documentary maker to sue him for libel. References Matsumoto, K. (2007), Radiocarbon-based circulation age of the world oceans, J. Geophys. Res., 112, C09004. Wunsch, 2014: Carl Wunsch and Patrick Heimbach, 2014: Bidecadal Thermal Changes in the Abyssal Ocean. J. Phys. Oceanogr., 44, 2013–2030.
A recent paper on ocean warming has been reported on in a number of newspaper articles, most recently by Christopher Booker in the Sunday Telegraph.
The author of the paper, Professor Carl Wunsch of MIT, wrote a letter to the editor of the Sunday Telegraph in response to Christopher Booker’s article. As the letter has yet to be published in the Sunday Telegraph, with the permission of Professor Wunsch we have decided to post it here.
Dear Editor,
In the Sunday Telegraph of 27 July 2014, Christopher Booker pretends to understand a highly technical paper on ocean warming to such a degree that he can explain it to his lay-audience. Had he made the slightest effort to contact me, I could have told him that the paper in reality says that the ocean is warming overall at a rate consistent with previous values – but that parts of the deepest ocean appear to be cooling. This inference is not a contradiction to overall warming. He imputes to me a wish to hide my views: nothing could be further from the truth. I believe that global warming is an extremely serious threat, but how that threat will play out in detail is scientifically still poorly understood. Anyone who interprets the complexity of change to mean global warming is not occurring and is not worrying, is ignorant enough to regard The Great Global Warming Swindle as a documentary – it is an egregious propaganda piece.
Carl Wunsch
Harvard University and Massachusetts Institute of Technology
 The House of Commons Energy and Climate Change Committee report on the Working Group 1 contribution to the IPCC Fifth Assessment Report, which is published today, has found the IPCC process to be robust. The committee launched an inquiry into the IPCC WG1 report in October 2013, following criticism by some commentators of the IPCC review process and its conclusions.
The Grantham Institute submitted written evidence to the committee (you can read our evidence here) and our Chair Professor Sir Brian Hoskins was called before the committee to give oral evidence.
The committee found that “the IPCC has responded extremely well to constructive criticism in the last few years and has tightened its review processes to make its Fifth Assessment Report (AR5) the most exhaustive and heavily scrutinised Assessment Report to-date. The MPs call on the IPCC to continue to improve its transparency, however. The IPCC would benefit, they say, from recruiting a small team of non-climate scientists to observe the review process and the plenary meetings where the Summary for Policymakers is agreed.”
Commenting on the report Professor Joanna Haigh, Co-Director Grantham Institute said:
“Having assessed a significant quantity of submitted evidence, both written and oral, this report is overwhelmingly supportive of both the procedures and the conclusions of the IPCC. It concludes that the WG1 report is the best available summary of the state of the science of climate change, that improvements to IPCC procedures since the Fourth Assessment have ensured “the highest Quality of scholarship” and that there is no scientific basis for downgrading UK’s ambition to reduce greenhouse gas emissions.
In terms of procedures it recommends two areas of further improvement – the appointment by governments of some non-climate scientists as members of the Executive Committee, and to observe the review process, and a greater level of transparency in plenary meetings discussing the Summary for Policymakers – but these recommendations in no way reflect concern about the content of the Assessment. A whole chapter of the report is devoted to examining criticisms that have been levelled, from both inside and outside the scientific community, on the scientific conclusions but none is found to have significant bearing.
Such a robust report from an all party parliamentary committee surely means that we can now reduce efforts spent on dealing with the constituencies working to discredit the IPCC, concentrate on understanding the science behind climate and climate change and do our best to make sure that the government plays a leading role in achieving a global deal on climate change.”
Professor Sir Brian Hoskins, Chair of the Grantham Institute said:
“The committee recognises that the recent WG1 report of IPCC gives a very good summary of the science relevant to climate change, whilst there are some remaining issues on transparency.
The question now is how do we respond to the risk posed by climate change, and I am pleased to see that the Report is clear: it supports the basis for the advice given by the Climate Change Committee and the path the UK is taking towards its 2050 carbon reduction target, in particular the 4th Carbon budget recently confirmed by Government, it advises that the UK Government at the top level should play a major role in international discussions leading up to Paris 2015.”
by Dr Flora Whitmarsh, Grantham Institute
 In an article for the Telegraph, Christopher Booker gave his views on Professor Sir Brian Hoskins’ appearance on the Today programme earlier this year. In the article, Booker made several claims about climate science relating to rainfall, atmospheric humidity, polar sea ice extent, global temperatures and sea level rise. In this blog I will assess his claims against the findings of the latest report of Working Group 1 of the Intergovernmental Panel on Climate Change (IPCC), a hugely comprehensive assessment of the scientific literature.
Booker’s comment: “Not even the latest technical report from the UN’s Intergovernmental Panel on Climate Change (IPCC) could find any evidence that rainfall and floods were increasing.”
Scientific Evidence:
The IPCC report found a significant climate influence on global scale changes in precipitation patterns (with medium confidence), including increases in precipitation in northern hemisphere mid to high latitudes. Further evidence of this comes from the observed changes in sea level salinity, an indication of the global distribution of evaporation and precipitation. The data is currently too inconclusive to report other regional changes in rainfall with confidence. Overall, however, there had been little change in land-based precipitation since 1900, contrasting with their 2007 assessment, which reported that global precipitation averaged over land areas had increased.
The IPCC concluded that there continues to be a lack of evidence and thus low confidence regarding the sign of trend in the magnitude and/or frequency of floods on a global scale.
The IPCC’s projected short-term changes (2016-35) in rainfall were:
There is also likely to be an increase in the frequency and intensity of heavy precipitation events over land. Regional changes will be strongly affected by natural variability and will also depend on future aerosol level (emissions and volcanic) and land use change.
Global rainfall totals are expected to go up in the longer term (i.e. beyond 2035) by around 1-3% per degree Celsius of global mean surface temperature increase, except in the very lowest emissions scenario.
Booker is partially right on past changes: the IPCC found no significant trend in global average rainfall over land. But this is not to say there has been no effect. Indeed, the expected increase in extreme heavy rain is already happening: the IPCC concluded with medium confidence that since 1951 there has been an increase in the number of heavy precipitation events in more regions than have had a decrease.
Read more about the impacts of climate change on UK weather
Booker’s comment: “From the official National Oceanic and Atmospheric Administration (NOAA) satellite data on humidity (shown on the “atmosphere page” of the science blog Watts Up With That), we see it has actually been falling.”
Scientific Evidence:
The key measure of whether atmospheric humidity is rising or falling is specific humidity, i.e. the mass of water vapour in a unit mass of moist air. The “atmosphere page” of “Watts Up With That” when accessed on 17 July wrongly shows data on relative humidity under the heading “Specific humidity”. Relative humidity is a measure that depends on temperature and does not therefore measure the absolute water vapour content of the atmosphere. In other words, Booker’s evidence is not evidence.
The latest IPCC report concludes that it is very likely that global near surface and tropospheric air specific humidity have increased since the 1970s. However, during recent years the near-surface moistening trend over land has abated (medium confidence). The magnitude of the observed global change in water vapour of about 3.5% in the past 40 years is consistent with the observed temperature change of about 0.5°C during the same period. The water vapour change can be attributed to human influence with medium confidence.
Booker’s comment: “As for polar ice, put the Arctic and the Antarctic together and there has lately been more sea ice than at any time since records began (see the Cryosphere Today website).”
Scientific Evidence:
The IPCC found that since 1979, annual Arctic sea ice extent has declined by 0.45-0.51 million km2 per decade and annual Antarctic sea ice extent has increased by 0.13-0.20 million km2 per decade. Taking the two IPCC estimates together, it can be inferred that total global sea ice extent has declined since 1979.
Sea ice thickness is harder to measure. The IPCC combined submarine-based measurements with satellite altimetry, concluding that Arctic sea ice has thinned by 1.3 – 2.3 m between 1980 and 2008. There is insufficient data to estimate any change in Antarctic sea ice thickness.
The reason why the Arctic sea ice has declined and the Antarctic sea ice hasn’t is because they have very different characteristics. Arctic sea ice is constrained by the North American and Eurasian landmasses to the south. In the central Arctic Ocean, the ice can survive several years, which allows it to thicken to several meters. Due to climate warming, the Arctic summer minimum has declined by around 11.5% per decade since 1979, and the extent of the ice that has survived more than two summers has declined by around 13.5% per decade over the same period. This has serious consequences for the surface albedo (reflectance) of the Arctic, as a reduction in the highly reflecting sea ice with less reflective open water results in enhanced absorption of solar radiation.
In contrast to the Arctic, Antarctic sea ice forms in the open ocean with no northern land to constrain its formation. The vast majority of Antarctic sea ice melts each summer.
Booker mentioned sea ice specifically, but he did not mention the other important components of the global cryosphere. Making use of better observations than were available at the time of their previous report in 2007, the IPCC carried out an assessment of all the ice on the planet and concluded that there had been a continued decline in the total amount of ice on the planet. The Greenland and Antarctic ice sheets are both losing mass (with very high confidence and high confidence respectively). Glaciers are known to be declining globally (with very high confidence). Overall snow cover, freshwater ice and frozen ground (permafrost) are also declining, although the available data is mostly for the Northern hemisphere.
Booker says: “As for Sir Brian’s claim that by 2100 temperatures will have risen by a further ‘3-5oC’, not even the IPCC dares predict anything so scary.”
Scientific evidence:
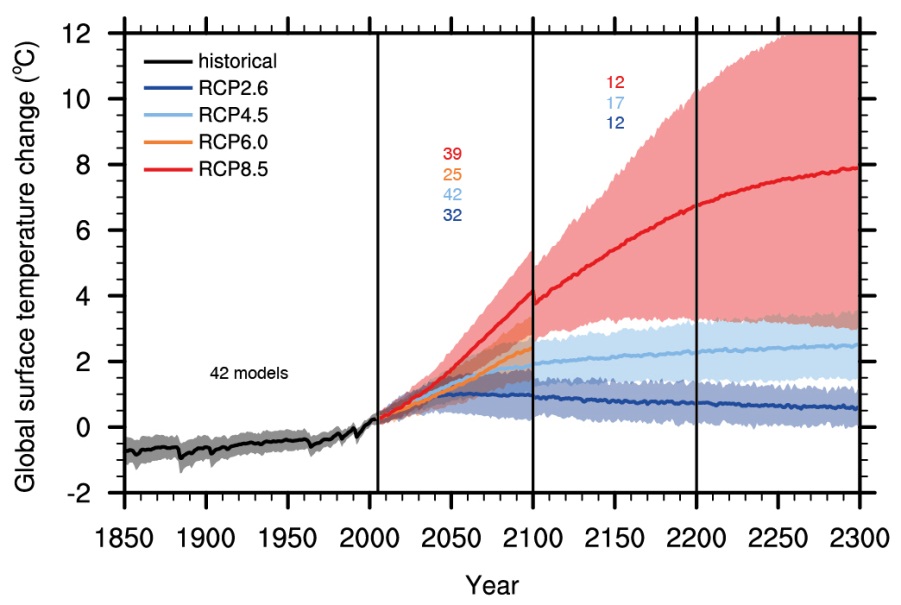
Future temperature rise of course depends on greenhouse gas emissions. In the lowest of the IPCC emissions scenarios, which assumes that global carbon dioxide emissions will decline after 2020, reach zero around 2080, and then continue dropping to just below zero by 2090, temperatures are projected to increase by another 0.3oC – 1.7oC by 2100. Total warming under this scenario is projected to be 0.9oC – 2.3oC relative to 1850-1900, i.e. including warming over the 20th century. Under the highest emissions scenario, the closest to business as usual, another 2.6oC – 4.8oC of warming is projected by 2100. In this case, the total projected temperature rise by 2100 is 3.2oC – 5.4oC when past temperature rise is included.
It is worth emphasising that if emissions are not constrained then we are likely to see a temperature rise of the same order as the projections under the IPCC’s highest emissions scenario. All three of the other scenarios assume that carbon dioxide emissions will peak and then decline substantially at some point in the coming decades. If emissions continue to rise then we should expect a total temperature increase in the region of 3.2oC – 5.4oC by the end of the century. This can of course be avoided if action is taken to reduce fossil fuel dependency.
Booker says: “[Professor Hoskins] was never more wobbly than when trying to explain away why there has now been no rise in average global temperatures for 17 years, making nonsense of all those earlier IPCC computer projections that temperatures should by now be rising at 0.3C every decade.”
Scientific evidence:
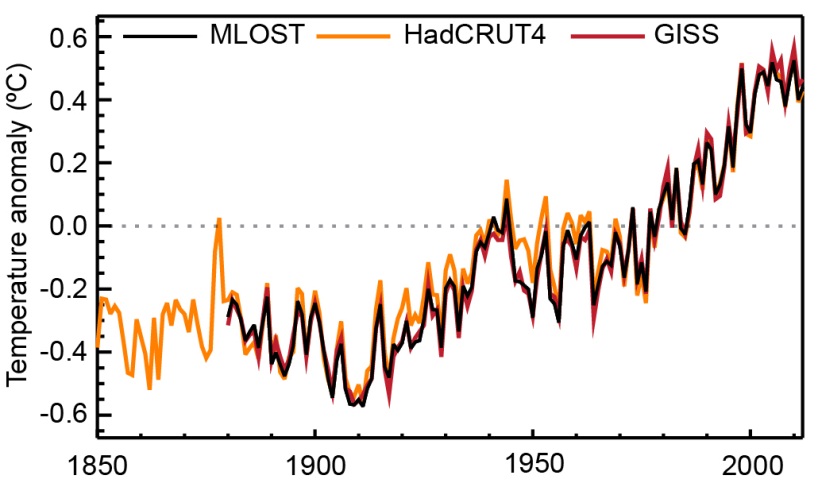
Climate change is a long term trend, and a few decades worth of data are needed to separate the warming trend from natural variability. Global mean surface temperature increased by about 0.85oC over the period 1880-2012. Each of the last three decades has been warmer than all previous decades in the instrumental record and the decade of the 2000s has been the warmest.
The observed temperature record over the 20th Century shows periods of slower and faster warming in response to a number of factors, most notably natural variability in the climate system, the changes in atmospheric composition due to large-scale human emissions of greenhouse gases and aerosols from burning fossil fuels and land-use change, volcanic activity and small changes in the level of solar activity.
In future, there will continue to be natural variation in temperature as well as a long term warming trend due to our greenhouse gas emissions. Significant natural climate variability means that a prolonged continuation of the current slowdown in the rate of increase would not on its own be strong evidence against climate change, provided that: 1) the global mean sea level continued to rise due to thermal expansion of the oceans, the melting of glaciers and loss of ice from ice sheets, and 2) the measured net energy flow into the climate system (predominantly the ocean) remained significantly positive.
The climate models used by the IPCC are not designed to predict the exact temperature of the Earth surface in a particular year or decade. This would require scientists to predict the future state of climatic phenomena such as the El Niño Southern Oscillation or the Pacific Decadal Oscillation for a specific period several years in advance, something that is not currently possible. Volcanic eruptions also have an impact on global temperatures, and they are not known about far enough in advance to be incorporated into the IPCC’s model projections.
Read more in our Grantham Note on the slowdown in global mean surface temperature rise
Booker says: “NOAA’s data show that the modest 200-year-long rise in sea levels has slowed to such an extent that, if its recent trend continues, by the end of the century the sea will have risen by less than seven inches.”
Scientific evidence:
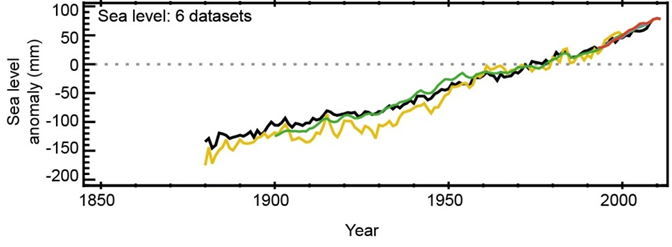
The IPCC assessed the relevant data carefully and concluded that sea level rose by around 19 cm (about 7 ½ inches) between 1901 and 2010. This is based on tide gauge data, with satellite data included after 1993. The rate of sea level rise was around 3.2 mm (about 1/8th inch) per year between 1993 and 2010. This is faster than the overall rate since 1901, indicating that sea level rise is accelerating as would be expected from thermal expansion of seawater and increased melting of ice on land.
Future sea level projections under the highest IPCC emissions scenario tell us what is likely to happen if emissions continue to rise unabated. In this case, sea level is projected to increase by a further 63 cm (about 24 ¾ inches) in the last two decades of this century compared with the 1986-2005 average. Even in the lowest emissions scenario, which requires substantial emissions reductions, another 40 cm (about 15 ¾ inches) of sea level rise can be expected by 2100.
Read more in our Grantham Note on sea level rise.
Reference for figures:
IPCC, 2013: Climate Change 2013: The Physical Science Basis. Contribution of Working Group I to the Fifth Assessment Report of the Intergovernmental Panel on Climate Change [Stocker, T.F., D. Qin, G.-K. Plattner, M. Tignor, S.K. Allen, J. Boschung, A. Nauels, Y. Xia, V. Bex and P.M. Midgley (eds.)]. Cambridge University Press, Cambridge, United Kingdom and New York, NY, USA, 1535 pp.
The IPCC has released corrected figures for past carbon dioxide emissions and future emissions trajectories quoted in the Summary for Policy Makers of the Working Group 1 report, “Climate Change 2013: The Physical Science Basis”. The original numbers were published in the report released on 27th September, which was subject to copy edit and final layout changes.
In total, six values from the summary have been changed. As noted by Professor Sir Brian Hoskins, Director of the Grantham Institute, these corrections are minor adjustments to historical greenhouse gas emissions and to the cumulative emissions consistent with achieving a 2 degree warming target with different levels of probability. The 2 degree target is significant because it forms the basis of international climate change negotiations. These minor corrections do not affect any of the conclusions drawn in the Summary for Policy Makers.
Since the IPCC did not do so, I have produced the following table to compare the new values to the original values for all the parameters that have changed. For each parameter, the difference between the original best estimate and the new best estimate is given in the right hand column. This is also expressed as a percentage of the original value. As can easily be seen, the changes in the parameters are all relatively small compared to the values of those parameters. Most are also small compared to the 90% uncertainty interval (range) given.
If you are unable to read the table below you can also view it here.
| Section of the SPM affected | Parameter changed | Value given in the version released on 27th Sep 2013 (gigatonnes of carbon, GtC) | New values, released 11th November 2013 (all in gigatonnes of carbon, GtC) | Comment |
| Section B.5, bullet 4 | Cumulative CO2 emissions from fossil fuel combustion and cement production over the period 1750 to 2011. | 365 [335 to 395] | 375 [345 to 405] | The best estimate and range revised upwards by 10 GtC, an increase of 2.7% in the best estimate. |
| Section B.5, bullet 4 | Cumulative anthropogenic CO2 emissions over the period 1750 to 2011. | 545 [460 to 630] | 555 [470 to 640] | Best estimate and range revised upwards by 10 GtC, an increase of 1.8% in the best estimate. |
| Section B.5, bullet 5 | The accumulation of carbon from anthropogenic CO2 emissions in natural terrestrial ecosystems over the period 1750 to 2011. | 150 [60 to 240] | 160 [70 to 250] | Best estimate and range revised upwards by 10 GtC, an increase of 6.7% in the best estimate. |
| Section E.8, bullet 2 | Total cumulative CO2 emissions from all anthropogenic sources to limit warming to less than 2°C (from CO2 alone) since the period 1861–1880 with a probability of >33%. | 0 to 1560 | 0 to 1570 | The maximum value was revised upwards by 10 GtC, a percentage increase of 0.64%. |
| Section E.8, bullet 2 | The maximum cumulative CO2 emissions from all anthropogenic sources for limiting warming to less than 2°C (including non-CO2 forcing as in RCP2.6 – the lowest emissions scenario used by the IPCC) listed for probabilities of >33%, >50%, and >66%. | 880, 840 and 800 | 900, 820 and 790 | Numbers changed by +20, -20 and -10 GtC. The percentage changes were +2.3%, -2.4% and -1.3%. |
| Section E.8, bullet 2 | Cumulative anthropogenic CO2 emissions over the period 1870 to 2011. | 531 [446 to 616] | 515 [445 to 585] | Best estimate reduced by 16 GtC, a decrease of 3%. Range also reduced from 170 to 140 GtC. |