New blog address
The Climate and Environment at Imperial blog has moved. Visit our new blog.
The Climate and Environment at Imperial blog has moved. Visit our new blog.
Grantham Institute Co-Director Professor Joanna Haigh discusses a recent paper which argues that existing climate models ‘run hot’ and overstate the extent of manmade climate change.
 It is perplexing that some climate change sceptics, who expend much energy in decrying global circulation (computer) models of the climate, on the basis that they cannot properly represent the entire complexities of the climate system and/or that they contain too many approximations, are now resorting to an extremely simplified model to support their arguments.
The model used in the Sci. Bull. article is a very useful tool for conceptualising the factors which contribute to the relationship between increasing concentrations of carbon dioxide in the atmosphere and global average temperature – indeed, we use such models as teaching aids for students studying atmospheric physics – but it is in no way fit for purpose as an accurate predictor of climate change. It requires as input the values of a number of parameters and, fundamentally, the choice of these values determines the predicted temperatures
Key here is the “feedback parameter” which represents the knock-on effects of changes in the atmosphere on the initial response to greenhouse gas warming. A positive feedback will make the temperature change larger and a negative one reduce it. For example, as the atmosphere warms it can hold more water vapour which itself is a greenhouse gas, acting to enhance the initial carbon dioxide-induced warming and thus giving a positive feedback. The physics of this process is very well-understood. There are a number of other, both positive and negative, feedback processes but overall, analyses of meteorological observations, modelling and understanding of the physical processes point to a significantly positive value. In the present paper the authors choose a very small value, based on temperatures measured in ice cores over the 810,000 year period of ice ages and inter-glacials. Their analysis is incomplete but anyway not relevant to changes in global climate over decadal-to-century timescales.
Thus by choosing an inappropriate value of the feedback parameter, and also judicious choices of other parameters, the authors end up with their “models run hot” conclusion. Must try harder.
By Dr Flora Whitmarsh, Grantham Institute
 The costs associated with reducing emissions in the UK have been discussed recently in the press. In an article in the Mail on Sunday, David Rose made the claim that energy policies shaped by the so-called “Green Blob” – a term coined by Owen Paterson for what he called “the mutually supportive network of environmental pressure groups, renewable energy companies and some public officials” – will cost the UK up to £400 billion by 2030, and that bills will rise by at least a third.
How much will action on climate change actually cost? The quoted figure of £400 billion equates to 1-1.5% of cumulative UK GDP over the next sixteen years. The most recent analysis to be carried out by the Intergovernmental Panel on Climate Change suggests that the costs of a low carbon economy would be around 1-4% of GDP globally by 2030. Analysis carried out by the AVOID consortium which includes Grantham Institute researchers found that the costs of staying within 2oC were 0.5-4% of global GDP, and a report on the costs of mitigation co-authored by the Grantham Institute put the costs at around 1% of global GDP. The figure quoted in the Mail on Sunday for the overall costs of decarbonisation is of the order of magnitude projected by experts, but these figures do not take into account the co-benefits of mitigation such as improved air quality and energy security. In fact a recent report by Cambridge Econometrics asserts that the UK’s decarbonisation pathway would lead to a net increase in GDP of 1.1% by 2030, due to structural changes in the economy and job creation resulting from the low-carbon transition.
Whilst these estimates relate to the economy-wide cost of using low-carbon energy rather than carbon-intensive sources such as fossil fuels, it is not immediately clear from them what this means for the cost of living. The rising cost of household energy is a key concern for people in the UK who have already seen significant increases in the average bill since 2004 mainly due to the rising cost of gas. In a report published in 2012, the Climate Change Committee concluded that support for low carbon technologies would add an average of £100 (10%) onto energy bills for a typical household by 2020 – where a typical household is one that uses gas for heating, and electricity for lighting and appliances. A further increase of £25 per household is projected by 2030, but this is less than in a scenario with high levels of investment in gas-fired power generation.
Furthermore, this could be partially offset by improvements in energy efficiency. The Climate Change Committee expects that by 2020 the replacement of old inefficient boilers will reduce bills by around £35 on average. The use of more efficient lights and appliances could reduce bills by a further £85, and improved efficiency in heating, mainly due to insulation, could save another £25 on average. However, making these savings would depend on having the right policies in place to encourage energy efficiency.
The Climate and Environment at Imperial blog has moved. View this post on our new blog
By Dr Flora Whitmarsh, Grantham Institute
The recent slowdown in global temperature rise has led to suggestions that global warming has stopped. In fact, the Earth system is still gaining heat, and the slowdown was likely caused by a series of small volcanic eruptions, a downward trend in the solar cycle, and increased heat uptake of the ocean. Writing in the Telegraph, Christopher Booker claims that a new paper by Professor Carl Wunsch (Wunsch, 2014) shows that ocean warming cannot explain the slowdown because the deeper ocean is in fact cooling rather than warming. Booker is incorrect in his interpretation of the paper, as Professor Wunsch explained in a letter of response to the Telegraph editor that was not published. Wunsch also wrote a letter to the editor of The Australian following a similarly misleading article in that newspaper. There are two threads to Christopher Booker’s argument in the Telegraph article. First, he suggests that the new paper refutes the idea that the pause is caused by an increase in ocean heat uptake, an interpretation that is untrue. Second, Booker gives a misleading interpretation of Wunsch’s appearance on the 2007 television documentary The Great Global warming Swindle in which Wunsch’s views were misrepresented by the documentary makers. Below, I describe the significance of ocean heat uptake and then discuss Booker’s two points in turn.
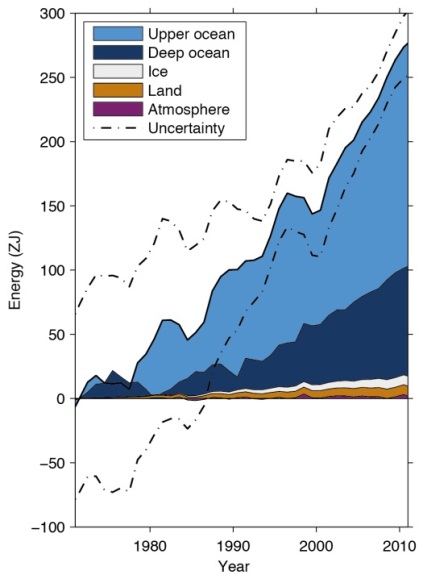
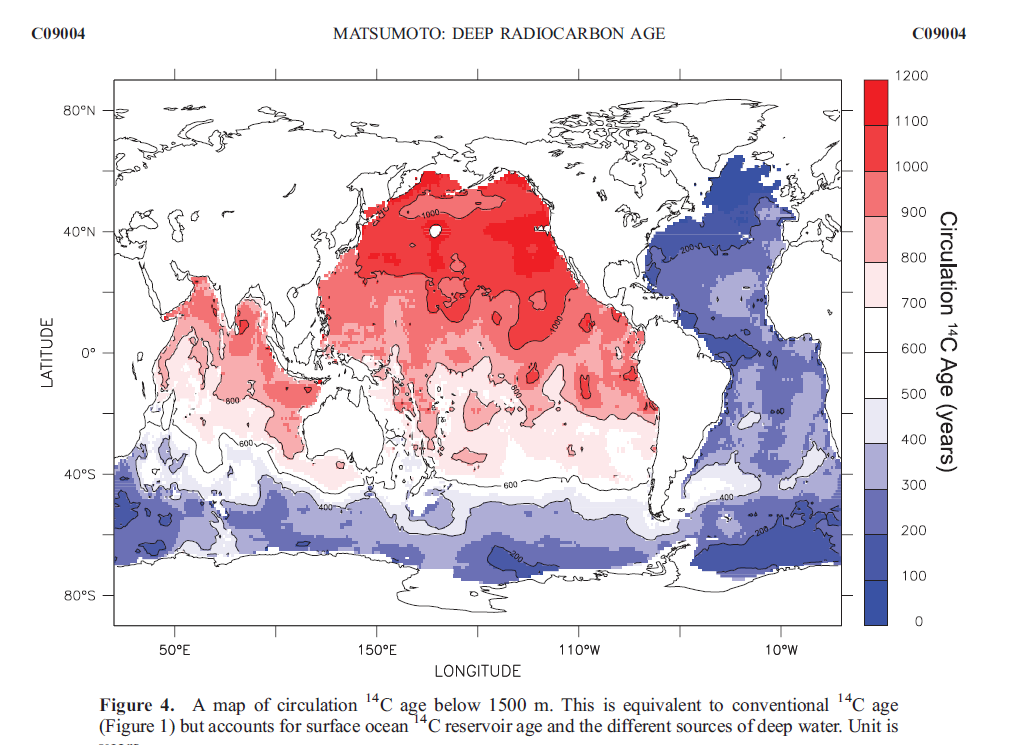
The ocean is an important heat sink and has taken up over 90% of the extra heat absorbed by the Earth system over the last century. There is natural variation in the amount of heat being taken up by the ocean. This is part of the reason why the observed increase in surface temperatures has not been uniform in the past. All studies including this latest one agree that the ocean above 2000 m is absorbing a significant amount of heat and this is the main focus of studies trying to detect and attribute global warming. The study of the ocean below 2000m is interesting from a scientific point of view but is less relevant to the study of climate change because it takes a very long time for heat to mix to these lower layers. Heat is transferred to the deep ocean by the movement of water masses – the mixing driven by the small-scale movement of water molecules is too slow to be of much significance. Due to the locations of the major ocean currents, parts of the deep ocean such as the western Atlantic and the Southern Ocean in the Antarctic have been in contact with the surface relatively recently, meaning they would be expected to have warmed due to global warming. By contrast, much of the Pacific Ocean below 1500 m has not been in contact with the surface for around a thousand years – something that has been demonstrated by studying the radioactive decay of carbon-14 atoms in a technique similar to the carbon dating of objects (Matsumoto, 2007 – see figure 2).
Christopher Booker writes, “Prof Carl Wunsch … has produced a paper suggesting not only that the warmists have no real evidence to support their claim other than computer modelling, but that the deeper levels of the oceans have, if anything, not been warming but cooling recently, thanks to climate changes dating back centuries.”
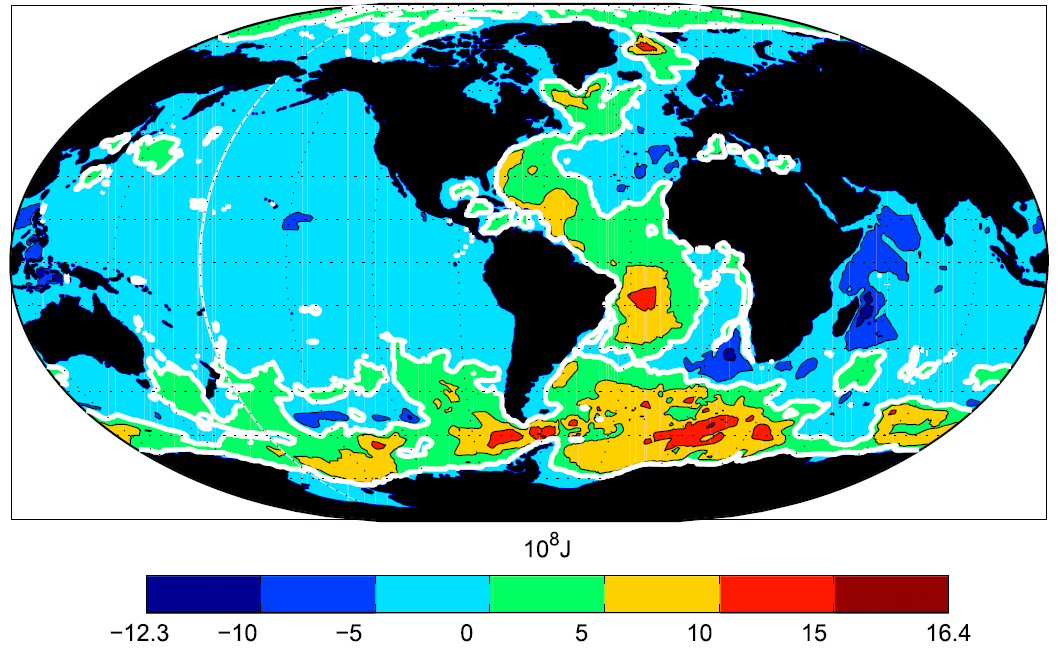
In the paper under discussion, Bidecadal Thermal Changes in the Abyssal Ocean, Wunsch looks at observations of ocean heat content. He found that the ocean as a whole and the top 700 m had gained heat since 1993, but that there had been an overall decline in heat content below 2000 m according to the available data. There has been a warming in the regions of the deep ocean below 2000 m where it would be expected due to the transport of water from the surface to the abyss by major ocean currents, i.e. the western Atlantic Ocean and the Southern Ocean (see figure 3). There was an observed cooling below 2000 m in other parts of the ocean including most of the Pacific. Much of the deep Pacific Ocean would not be expected to have warmed due to climate change because the water has not been in recent contact with the surface (figure 2). The available observations are very sparse and only about a third of the water below 2000 m was sampled at all during the period under discussion, meaning it is not known whether these results reflect a genuine cooling below 2000 m. Because there was heating in some places and cooling in others, it is particularly hard to accurately determine the mean from very sparse observations. The main conclusion of Wunsch, 2014 was in fact that more observations are needed to improve our understanding of processes involved in transporting water to the deep ocean. This is a subject which has received relatively little attention, with much more research effort being concentrated on the upper ocean. It is likely that this is partially due to the difficulty involved in observing the ocean at depth, and partly because the upper ocean is of interest due to its direct impact on weather patterns, for example through its role in the formation of El Niño and La Niña conditions. None of this changes the fact that the Earth system as whole is gaining heat, and that a significant proportion of that heat is being taken up by the ocean, mostly in the top 700 m. The paper doesn’t significantly change our understanding of the pause in surface temperature rise. We know that natural processes do change the amount of heat taken up by the ocean over time, and that surface temperature rise has not been uniform in the past. However, precisely quantifying how much heat has been taken up by the deep ocean is still not possible with current observations.
Referring to the 2007 television documentary, The Great Global Warming Swindle, Booker suggested that Wunsch had privately held “sceptic” views at the time the programme was aired, but didn’t feel able to express these views in public, “So anxious is the professor not to be seen as a “climate sceptic” that, [after being interviewed for] The Great Global Warming Swindle, he complained to Ofcom that, although he had said all those things he was shown as saying, he hadn’t been told that the programme would be dedicated to explaining the scientific case against global warming.” Professor Wunsch’s views on The Great Global Warming Swindle are explained at length on his professional webpage in an article dated March 2007. I will not paraphrase his comments in detail, but suffice it to say he states his belief that “climate change is real, a major threat, and almost surely has a major human-induced component”, and wrote to the documentary makers to say, “I am the one who was swindled” because they misrepresented his views by quoting him out of context. In an update written three months later, Wunsch made it clear that he did not complain to Ofcom under duress from other scientists. In fact, he felt so strongly that his opinions had been misrepresented that he filed his complaint despite threats by the documentary maker to sue him for libel. References Matsumoto, K. (2007), Radiocarbon-based circulation age of the world oceans, J. Geophys. Res., 112, C09004. Wunsch, 2014: Carl Wunsch and Patrick Heimbach, 2014: Bidecadal Thermal Changes in the Abyssal Ocean. J. Phys. Oceanogr., 44, 2013–2030.
A recent paper on ocean warming has been reported on in a number of newspaper articles, most recently by Christopher Booker in the Sunday Telegraph.
The author of the paper, Professor Carl Wunsch of MIT, wrote a letter to the editor of the Sunday Telegraph in response to Christopher Booker’s article. As the letter has yet to be published in the Sunday Telegraph, with the permission of Professor Wunsch we have decided to post it here.
Dear Editor,
In the Sunday Telegraph of 27 July 2014, Christopher Booker pretends to understand a highly technical paper on ocean warming to such a degree that he can explain it to his lay-audience. Had he made the slightest effort to contact me, I could have told him that the paper in reality says that the ocean is warming overall at a rate consistent with previous values – but that parts of the deepest ocean appear to be cooling. This inference is not a contradiction to overall warming. He imputes to me a wish to hide my views: nothing could be further from the truth. I believe that global warming is an extremely serious threat, but how that threat will play out in detail is scientifically still poorly understood. Anyone who interprets the complexity of change to mean global warming is not occurring and is not worrying, is ignorant enough to regard The Great Global Warming Swindle as a documentary – it is an egregious propaganda piece.
Carl Wunsch
Harvard University and Massachusetts Institute of Technology
by Dr Flora Whitmarsh, Grantham Institute
 In an article for the Telegraph, Christopher Booker gave his views on Professor Sir Brian Hoskins’ appearance on the Today programme earlier this year. In the article, Booker made several claims about climate science relating to rainfall, atmospheric humidity, polar sea ice extent, global temperatures and sea level rise. In this blog I will assess his claims against the findings of the latest report of Working Group 1 of the Intergovernmental Panel on Climate Change (IPCC), a hugely comprehensive assessment of the scientific literature.
Booker’s comment: “Not even the latest technical report from the UN’s Intergovernmental Panel on Climate Change (IPCC) could find any evidence that rainfall and floods were increasing.”
Scientific Evidence:
The IPCC report found a significant climate influence on global scale changes in precipitation patterns (with medium confidence), including increases in precipitation in northern hemisphere mid to high latitudes. Further evidence of this comes from the observed changes in sea level salinity, an indication of the global distribution of evaporation and precipitation. The data is currently too inconclusive to report other regional changes in rainfall with confidence. Overall, however, there had been little change in land-based precipitation since 1900, contrasting with their 2007 assessment, which reported that global precipitation averaged over land areas had increased.
The IPCC concluded that there continues to be a lack of evidence and thus low confidence regarding the sign of trend in the magnitude and/or frequency of floods on a global scale.
The IPCC’s projected short-term changes (2016-35) in rainfall were:
There is also likely to be an increase in the frequency and intensity of heavy precipitation events over land. Regional changes will be strongly affected by natural variability and will also depend on future aerosol level (emissions and volcanic) and land use change.
Global rainfall totals are expected to go up in the longer term (i.e. beyond 2035) by around 1-3% per degree Celsius of global mean surface temperature increase, except in the very lowest emissions scenario.
Booker is partially right on past changes: the IPCC found no significant trend in global average rainfall over land. But this is not to say there has been no effect. Indeed, the expected increase in extreme heavy rain is already happening: the IPCC concluded with medium confidence that since 1951 there has been an increase in the number of heavy precipitation events in more regions than have had a decrease.
Read more about the impacts of climate change on UK weather
Booker’s comment: “From the official National Oceanic and Atmospheric Administration (NOAA) satellite data on humidity (shown on the “atmosphere page” of the science blog Watts Up With That), we see it has actually been falling.”
Scientific Evidence:
The key measure of whether atmospheric humidity is rising or falling is specific humidity, i.e. the mass of water vapour in a unit mass of moist air. The “atmosphere page” of “Watts Up With That” when accessed on 17 July wrongly shows data on relative humidity under the heading “Specific humidity”. Relative humidity is a measure that depends on temperature and does not therefore measure the absolute water vapour content of the atmosphere. In other words, Booker’s evidence is not evidence.
The latest IPCC report concludes that it is very likely that global near surface and tropospheric air specific humidity have increased since the 1970s. However, during recent years the near-surface moistening trend over land has abated (medium confidence). The magnitude of the observed global change in water vapour of about 3.5% in the past 40 years is consistent with the observed temperature change of about 0.5°C during the same period. The water vapour change can be attributed to human influence with medium confidence.
Booker’s comment: “As for polar ice, put the Arctic and the Antarctic together and there has lately been more sea ice than at any time since records began (see the Cryosphere Today website).”
Scientific Evidence:
The IPCC found that since 1979, annual Arctic sea ice extent has declined by 0.45-0.51 million km2 per decade and annual Antarctic sea ice extent has increased by 0.13-0.20 million km2 per decade. Taking the two IPCC estimates together, it can be inferred that total global sea ice extent has declined since 1979.
Sea ice thickness is harder to measure. The IPCC combined submarine-based measurements with satellite altimetry, concluding that Arctic sea ice has thinned by 1.3 – 2.3 m between 1980 and 2008. There is insufficient data to estimate any change in Antarctic sea ice thickness.
The reason why the Arctic sea ice has declined and the Antarctic sea ice hasn’t is because they have very different characteristics. Arctic sea ice is constrained by the North American and Eurasian landmasses to the south. In the central Arctic Ocean, the ice can survive several years, which allows it to thicken to several meters. Due to climate warming, the Arctic summer minimum has declined by around 11.5% per decade since 1979, and the extent of the ice that has survived more than two summers has declined by around 13.5% per decade over the same period. This has serious consequences for the surface albedo (reflectance) of the Arctic, as a reduction in the highly reflecting sea ice with less reflective open water results in enhanced absorption of solar radiation.
In contrast to the Arctic, Antarctic sea ice forms in the open ocean with no northern land to constrain its formation. The vast majority of Antarctic sea ice melts each summer.
Booker mentioned sea ice specifically, but he did not mention the other important components of the global cryosphere. Making use of better observations than were available at the time of their previous report in 2007, the IPCC carried out an assessment of all the ice on the planet and concluded that there had been a continued decline in the total amount of ice on the planet. The Greenland and Antarctic ice sheets are both losing mass (with very high confidence and high confidence respectively). Glaciers are known to be declining globally (with very high confidence). Overall snow cover, freshwater ice and frozen ground (permafrost) are also declining, although the available data is mostly for the Northern hemisphere.
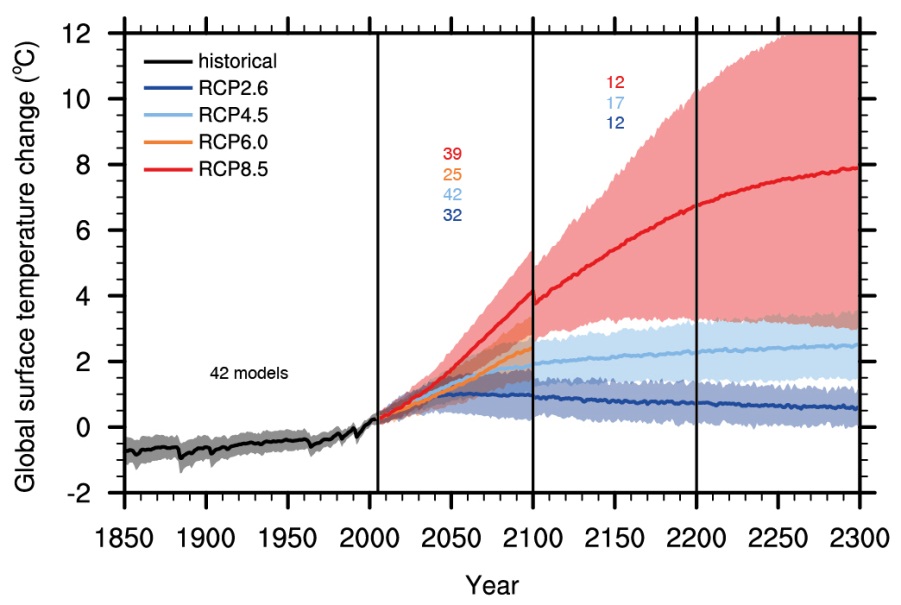
Booker says: “As for Sir Brian’s claim that by 2100 temperatures will have risen by a further ‘3-5oC’, not even the IPCC dares predict anything so scary.”
Scientific evidence:
Future temperature rise of course depends on greenhouse gas emissions. In the lowest of the IPCC emissions scenarios, which assumes that global carbon dioxide emissions will decline after 2020, reach zero around 2080, and then continue dropping to just below zero by 2090, temperatures are projected to increase by another 0.3oC – 1.7oC by 2100. Total warming under this scenario is projected to be 0.9oC – 2.3oC relative to 1850-1900, i.e. including warming over the 20th century. Under the highest emissions scenario, the closest to business as usual, another 2.6oC – 4.8oC of warming is projected by 2100. In this case, the total projected temperature rise by 2100 is 3.2oC – 5.4oC when past temperature rise is included.
It is worth emphasising that if emissions are not constrained then we are likely to see a temperature rise of the same order as the projections under the IPCC’s highest emissions scenario. All three of the other scenarios assume that carbon dioxide emissions will peak and then decline substantially at some point in the coming decades. If emissions continue to rise then we should expect a total temperature increase in the region of 3.2oC – 5.4oC by the end of the century. This can of course be avoided if action is taken to reduce fossil fuel dependency.
Booker says: “[Professor Hoskins] was never more wobbly than when trying to explain away why there has now been no rise in average global temperatures for 17 years, making nonsense of all those earlier IPCC computer projections that temperatures should by now be rising at 0.3C every decade.”
Scientific evidence:
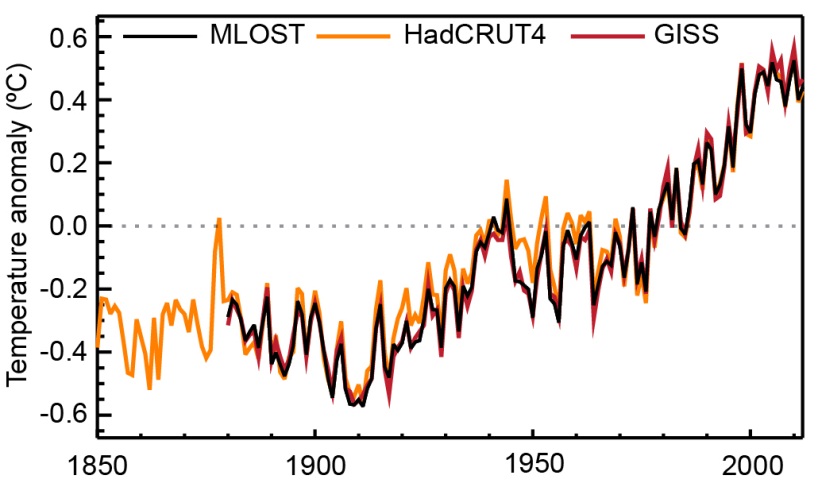
Climate change is a long term trend, and a few decades worth of data are needed to separate the warming trend from natural variability. Global mean surface temperature increased by about 0.85oC over the period 1880-2012. Each of the last three decades has been warmer than all previous decades in the instrumental record and the decade of the 2000s has been the warmest.
The observed temperature record over the 20th Century shows periods of slower and faster warming in response to a number of factors, most notably natural variability in the climate system, the changes in atmospheric composition due to large-scale human emissions of greenhouse gases and aerosols from burning fossil fuels and land-use change, volcanic activity and small changes in the level of solar activity.
In future, there will continue to be natural variation in temperature as well as a long term warming trend due to our greenhouse gas emissions. Significant natural climate variability means that a prolonged continuation of the current slowdown in the rate of increase would not on its own be strong evidence against climate change, provided that: 1) the global mean sea level continued to rise due to thermal expansion of the oceans, the melting of glaciers and loss of ice from ice sheets, and 2) the measured net energy flow into the climate system (predominantly the ocean) remained significantly positive.
The climate models used by the IPCC are not designed to predict the exact temperature of the Earth surface in a particular year or decade. This would require scientists to predict the future state of climatic phenomena such as the El Niño Southern Oscillation or the Pacific Decadal Oscillation for a specific period several years in advance, something that is not currently possible. Volcanic eruptions also have an impact on global temperatures, and they are not known about far enough in advance to be incorporated into the IPCC’s model projections.
Read more in our Grantham Note on the slowdown in global mean surface temperature rise
Booker says: “NOAA’s data show that the modest 200-year-long rise in sea levels has slowed to such an extent that, if its recent trend continues, by the end of the century the sea will have risen by less than seven inches.”
Scientific evidence:
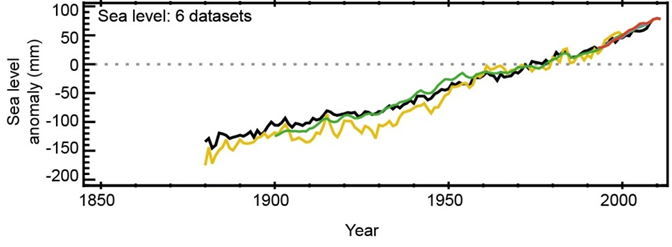
The IPCC assessed the relevant data carefully and concluded that sea level rose by around 19 cm (about 7 ½ inches) between 1901 and 2010. This is based on tide gauge data, with satellite data included after 1993. The rate of sea level rise was around 3.2 mm (about 1/8th inch) per year between 1993 and 2010. This is faster than the overall rate since 1901, indicating that sea level rise is accelerating as would be expected from thermal expansion of seawater and increased melting of ice on land.
Future sea level projections under the highest IPCC emissions scenario tell us what is likely to happen if emissions continue to rise unabated. In this case, sea level is projected to increase by a further 63 cm (about 24 ¾ inches) in the last two decades of this century compared with the 1986-2005 average. Even in the lowest emissions scenario, which requires substantial emissions reductions, another 40 cm (about 15 ¾ inches) of sea level rise can be expected by 2100.
Read more in our Grantham Note on sea level rise.
Reference for figures:
IPCC, 2013: Climate Change 2013: The Physical Science Basis. Contribution of Working Group I to the Fifth Assessment Report of the Intergovernmental Panel on Climate Change [Stocker, T.F., D. Qin, G.-K. Plattner, M. Tignor, S.K. Allen, J. Boschung, A. Nauels, Y. Xia, V. Bex and P.M. Midgley (eds.)]. Cambridge University Press, Cambridge, United Kingdom and New York, NY, USA, 1535 pp.