Author: Alexandra Cheung

Time to Act climate march – what was missing?

by Jonathan Bosch

climate protesters
Over 20,000 people attended the march

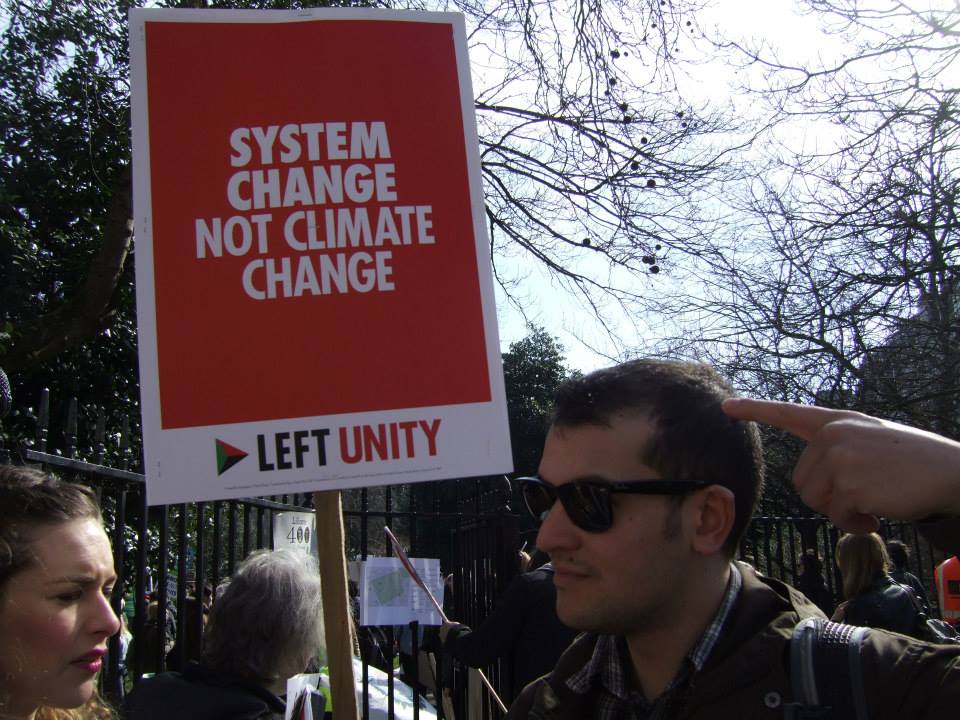
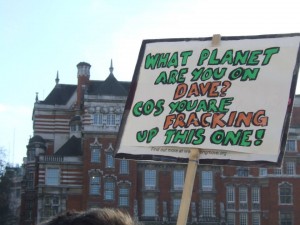
On Saturday, 7th March 2015, I attended the Time to Act climate march. After a winding route through the historic streets of central London, an impromptu sit-down on the Strand, and a spirit-raising day under an early spring sun, we converged on Parliament Square where a number of speakers from charities, trade unions, political parties and other activist groups launched their rallying cries for climate justice, aiming their anger squarely upon the walls of the houses of parliament: the centre of British democracy – those with the power to make change, but who perhaps far too often stand in its way.

For me, it was a particularly sobering experience. Not since my first protest attendance at the million-strong “No War on Iraq” protest of February 2003 had I attended a public protest – it’s still feted as probably the largest protest movement in human history – and I was enthusiastic this time, to show up, hold up my placard, and join thousands of concerned citizens to convey our collective anger at what I see to be the complicit and complacent inaction of our government on the urgent challenges of climate and environmental change, in opposition to the rational, fair minded and compassionate citizenry of the United Kingdom.

However, after the excitement of the day had worn off, I couldn’t help but feel somewhat deflated by the realities of the movement as it exists today, nearly four decades after global warming was raised as an international concern at the World Climate Conference in Geneva in 1979. A decade too, before I was even born.

timetoact2My main concern was that the attendees, despite coming seemingly from all walks of life, were not justly represented by the big-name speakers in attendance. For sure, there was representation by Greenpeace and Avaaz and many of the usual charitable organisations. There was also representation by a number of trade unions and the equally impassioned orators of environmental-cause NGOs and celebrity activists.

But none of the mainstream political parties were present, bar one left-wing Labour MP, John McDonnell. Is climate change an issue undeserving of the legitimacy of our democratic process?

There were however a few refreshingly erudite voices in the form of Bangladeshi campaigner Rumana Hashem, comedian, Francesca Martinez, and the blazing writer and activist – via recorded video message – Naomi Klein, author of This Changes Everything.

Then there was 12 year-old Laurel, who spoke simply on behalf of her generation.

Our climate legacy is to 12 year old Laurel and her generation.


A science-shaped gap

The most invisible group, but those very often with the most to say, were the climate scientists themselves.

There were no scientists in the list of speakers; no scientific media organisations handing out materials; and no science representative block, as there were for many environmental interest groups.

Scientists are absent from the fight. They reliably churn out results, smoothing the climate curves, adding degrees to our predicted future surface temperatures, and adding calamity to the already calamitous ice sheet collapses, and yet we/they stay as staunchly apolitical as ever, perhaps for fear of being discredited as impartial scientists.

But to me, it’s the voice that is most obviously missing from the activist debate. Yes, there are scientists on government panels, and in IPCC working groups, but these are only the places that scientists have a duty to be. It is clear however that any paradigm shifting fight, as demonstrated in the previous century, requires grassroots activism. Not accepting the status quo. It was how civil rights were won in the US, how the suffragettes won women’s rights, and how wars became politically toxic worldwide.

The point often repeated by the many trade union and intellectual activists is that climate change is not only a non-partisan issue, but an issue which many interest groups would gain leverage if they acted together. For example, the occupy movement, anti-capitalist, and others all have a strong mandate to rid the system of austerity politics, rampant capitalism, and the huge projected industrial emissions that go along with it. Likewise scientists are fighting a lonely battle if they insist on fighting from high up in their ivory towers.

For the reasons above, and for the very longevity of our own species, I believe that it has become the job of scientists, not only to carry on doing the science that is imperative to human progress, but also to become activists, reporters and educators on this, the main issue of the 21st century.


 Guardian coverage of the march

High altitude agriculture – The challenges of adapting to the changing water supply in the Himalayas

by Bhopal Pandeya, Research Associate (ESPA Fellowship), Grantham Institute

Agricultural land
Agricultural lands in the Himalayan region

Mountains are often referred to as ‘water towers’ as they provide fresh water to people and biodiversity. The Himalayan region is one of the few hot spots where several big rivers originate and supply water to hundreds of millions of people across the mountains and further downstream. However, higher up in the mountains especially in trans-Himalayan region, there is very little accessible water for local communities. The region receives very low rainfall and thus water supply is largely dependent on the timely occurrence of snow fall and ice melts in the upper mountains. The Upper Kaligandaki Basin (located in Nepal) is one such area where water scarcity is very high. Upland communities are constantly facing serious water shortage which particularly affects their agricultural land.

In Upper Kaligandaki Basin, croplands are located along the river valleys which act as oases in the Himalayas. Traditionally, local people practice an intensive cropping system, growing different crops and vegetables to sustain their lives, and agricultural remains the main source of local livelihoods. But, local people are experiencing increasing difficulty with farming largely due to the unpredictable nature of water supply in local streams. They are now concerned by the changing pattern of snow fall in upper mountain areas and its impact on water flow in the lower regions. People are trying to cope with this situation by adopting various measures such as introducing more resilient crops like apple and walnut, using water harvesting systems and equitably sharing available water. This demonstrates local people’s extraordinary adaptive skills in managing their resources sustainably. To some extent, these measures are helpful in coping with these uncertainties.

apple trees
Apple farming in the Upper Kaligandaki Basin – an adaptive agricultural practice

Recent developments in the region, especially the construction of roads and the expansion of human settlements, are proving unsustainable and are making already scarce agricultural lands even more vulnerable. These activities lack proper consideration of how to maintain key ecosystem services provided by water and soil resources. Agricultural land and traditional water supply systems are particularly threatened by constant encroachment and land degradation (erosion and landslides) resulting from these activities. As a result, local communities’ main sources of livelihoods are in great danger. At the same time, the whole region is passing through a socio-cultural and demographic transformation which is also challenging especially considering the lack of enthusiasm of younger generations for farming.

Development activities clearly demand integration of a natural capital based approach

In this situation, an innovative approach can build a better understanding of these major ecosystem services and integrate them into local policy and decision making. As one elderly local firmly put it, “our farmlands are highly productive, no need to go abroad for earning… we can earn better here. We produce highly priced crops, fruits and vegetables. But, there are some big problems… water supply is becoming more disruptive, soil loss is extensive and there is also less and less participation of the younger generation in farming practices. We need to address these problems immediately, so we can improve the agricultural production and increase our household incomes”. Clearly there is a great need for a locally suited ecosystem services approach (guided by scientific, socio-political and economic understandings) to improve local livelihoods.


Find out more about the Mountain-EVO project


This post was originally published on the ESPA blog. View original post.

Hard Evidence: will climate change affect the spread of tropical diseases?

Asian Tiger Mosquito
The Asian Tiger Mosquito (Aedes albopictus) can transmit dengue fever

The Climate and Environment at Imperial blog has moved. View this post on our new blog 

By Dr Paul Parham, Honorary Lecturer in Infectious Disease Epidemiology

Many tropical diseases such as malaria, Chagas disease and dengue are transmitted to humans via mosquitoes and other carriers known as vectors. These vector-borne diseases continue to have a major impact on human health in the developing world: each year, more than a billion people become infected and around a million people die. In addition, around one in six cases of illness and disability worldwide arise from these diseases.

Malaria arguably continues to attract the most attention of all the vector-borne diseases by virtue of causing the greatest global disease burden. However, others such as dengue are not only resurgent in some regions, but threaten a vast proportion of the world’s population.

Climate change remains a substantial threat to future human health and since the behaviour of disease carriers like mosquitoes is known to be extremely sensitive to temperature and rainfall, it seems unquestionable that climate change will affect many, if not all, of these diseases. What is less clear, however, is the extent to which climate increases the risk of becoming infected in certain regions compared to other factors such as poverty or fragile health systems.

In addition, although the number of new cases of diseases such as malaria appears to be declining worldwide, it is still increasing in many regions for a variety of reasons; the continued spread of insecticide resistance, changes in land use, and difficulties in maintaining political interest pose considerable challenges. Which of these factors will be most influential over the coming decades remains up for debate and one that was raised in a special edition of Philosophical Transactions B.

Changes in risk

The latest research, however, is clear and consistent in many of its findings. Different diseases, transmitted by different vectors, respond in different ways to changing weather and climate patterns. Climate change is very likely to favour an increase in the number of dengue cases worldwide, while many important mosquito populations that are able to transmit devastating diseases are changing in their distribution.

The latest maps show that many areas of Europe (including the UK) could become increasingly hospitable for mosquitoes that transmit dengue over the coming decades (the map below shows a projected change in suitable habitat for the Aedes albopictus mosquito). Similarly, other mosquito range expansions are likely to occur in the US and eastern Asia. If dengue and/or chikungunya are imported into these regions, there will be a considerable increase in the worldwide number of vulnerable individuals.

European map of simulated Aedes albopictus habitat suitability based on one future climate projection for the period 2045-2054.

It is also clear that small changes in these so-called risk maps can have very large public health impacts. Tick-borne diseases (such as Lyme disease) are also predicted to expand in range as climate changes. Although, as before, plenty of other factors are likely to contribute, meaning that direct causation is very hard to attribute.

It is important to remember too that climate change is not just global warming; the latter refers to an increase in global mean temperatures, but there is also an overwhelming body of evidence demonstrating that rainfall is at least as important for many vector-borne diseases. Rainfall episodes have also been shown to provide a very good early-warning sign a few months in advance for outbreaks of West Nile Virus.

New research on African anti-malaria mosquito control programmes that involve spraying houses (to kill indoor mosquitoes) and distributing bed nets also shows that both temperature and rainfall can influence the degree to which programmes decrease new infections and, crucially, their cost-effectiveness. However, whether or not this is substantial enough to affect regional policy decisions about scaling up mosquito control programmes depends on factors such as how rapidly insecticide resistance emerges, the human immune response to malaria, and country-specific conditions.

In terms of malaria elimination in Africa, adopting the same approach in all affected regions is unlikely to be the best way forward. However, there is some new evidence to suggest that if efforts continue to be concentrated on scaling-up current intervention programmes in regions close to elimination, the longer-term effects of climate change will become far less important. Indeed, one of the most effective ways of protecting human health against climate change in the long-term is to further strengthen current disease control efforts.

Mathematical models

As with the formulation of public health policies to deal with diseases such as Ebola, flu, and HIV, mathematical models are valuable tools that are widely used to make predictions about how different carrier-borne diseases are likely to respond to climatic changes. How reliable these predictions are is an important question and, like many areas of science, include unavoidable uncertainties. For example, people may change their behaviour and actions as climate change evolves – for example by migrating to other areas – which evidently makes forecasting more difficult.

New evidence has also shown that disease vectors may evolve in under a decade to changes in temperature, which conflicts with many current models that assume climate change only affects their ecology, not their evolution. Predictions that might be affected by climate change must therefore not only take account of these uncertainties, if they’re to be more reliable and useful, but also recognise that these predictions cannot strictly be disproved until the future arrives.

This remains a very active research field, but considerable progress in our understanding has been made over the last ten to 15 years. Better data on the links between vectors, diseases they carry and the environment is definitely required, as are better ways of quantifying disease risk for different populations and different diseases.

 Seven steps to understanding climate impacts and assessing risks. Philosophical Transactions B

Seven steps to understanding climate impacts and assessing risks.
Philosophical Transactions B

Future challenges

Many diseases have received very little attention so far on how climate change may affect future trends. One example is onchocerciasis (river blindness), for which tentative predictions suggest that we might expect substantial increases in the number of disease vectors in certain African regions over the coming decades.

Almost all models are currently based on single diseases, but many populations are unfortunately burdened with multiple diseases at any one time; understanding how climate change affects interactions between these diseases has attracted little attention to date.

One other important challenge for the field is the mismatch between the data current global climate models are able to provide and the information required by local public health officials to make more informed decisions; continued improvements in computing power are essential to progress. The predictions of our current models are not perfect and improvements in our understanding are certainly required.

To date, we have tended to react to disease outbreaks as they occur, but we need an increased focus on being more proactive; we cannot stop outbreaks of many of these diseases, but proactive risk management is less expensive (and more effective) than responding after a crisis. Ultimately, the challenge is not to address specific health risks due solely to climate change, but instead to ensure sustained progress is made towards decreasing the number of deaths and cases of these diseases for future generations.

The Conversation

This article was originally published on The Conversation.
Read the original article.

conversation-logo

The global health benefits of tackling climate change

The Climate and Environment at Imperial blog has moved. View this post on our new blog 

by Professor Paolo Vineis and Pauline Scheelbeek, School of Public Health
Cycling

It is sometimes claimed that addressing climate change with proper policies is too expensive and could lead to a further decline in the economy. However, the co-benefits of implementation of climate change mitigation strategies for the health sector are usually overlooked. The synergy between policies for climate change mitigation in sectors such as energy use (e.g. for heating), agriculture, food production and transportation may have overall benefits that are much greater than the sum of single interventions (Haines et al, 2009). Here we describe a few examples of climate change mitigation strategies that have important co-benefits for global health.

  1. Reducing CO2 admission by promotion of active transport

The transportation sector is often the single largest source of greenhouse gas emissions in urban areas. Policy makers have tried to reduce these emissions by discouraging car travel and promoting other means of (active) transport. Active transport, such as cycling and walking, increases daily physical activity. Physical inactivity is one of the leading causes of non-communicable diseases all over the world. It has been estimated that the combination of active travel and lower-emission motor vehicles would give large health benefits, notably from a reduction in the number of years of life lost from coronary heart disease (10-19% in London, 11-25% in Delhi according to Woodcock et al, 2009). Also obesity, which is increasing dramatically all over the world, particularly in children, could effectively be reduced by a more active lifestyle. A 30-minute walk per day could – on many occasions – be enough to even out slight caloric excess.

  1. Domestic energy management & reduction of cooking/heating emissions

Improving heating and cooking systems – for example by making them more efficient – reduces energy consumption. Improved models of stoves (electrical vs biomass) allow a 15-times reduction in the emission of particles and other pollutants, thus contributing to decreased emissions in the atmosphere. Especially in developing countries – where old stoves are common – these improvements could also have a considerable positive impact on health: cooking on simple wood or coal stoves currently forms a major source of indoor pollution and increases risk of certain chronic diseases, such as chronic obstructive pulmonary disease (COPD). The potential effectiveness of this strategy was shown by Wilkinson et al: they calculated that if 150 million low-emission cookstoves were introduced in India, this could lead to the prevention of an estimated 1.3 million deaths from COPD and hundreds of thousands of deaths from other diseases such as coronary heart disease (Wilkinson, et al 2009). Air pollution is one of the biggest environmental causes of death worldwide, with household air pollution accounting for about 3·5-4 million deaths every year (Gordon et al, 2014).

  1. Reductions in CO2 through reduced meat production

meat production diagram
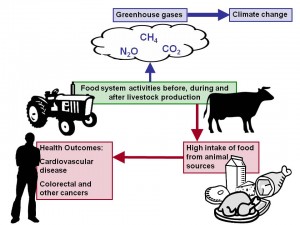
Meat production is highly inefficient energetically: it requires an extremely high use of water and land per unit of meat.  One fifth of all greenhouse gases worldwide are related to methane production from livestock farms.  Reduction of meat intake by consumers would lower meat production and is therefore often promoted as climate change mitigation strategy. The figure shows that a high intake of meat is also associated with increased disease risk, in particular for certain cancers and cardiovascular disease (WCRF, 2007). Reduced meat consumption would therefore also have a major impact on public health. It has been estimated that a 30% reduction in livestock production in the UK would reduce cardiovascular deaths by 15% (Friel et al, 2009).


  1. Low carbon energy production

Non-renewable energy production, for example coal burning, is a major contributor to worldwide greenhouse gas emissions. Many countries have adopted policies to reduce polluting energy production and stimulate production of (renewable) energy through cleaner sources. For example, since 2000, the government in the Chinese Shanxi province has promoted several initiatives (including factory shutdowns) with the goal of reducing coal burning emissions. The annual average particulate matter (PM10) concentrations decreased from 196 μg/m3 in 2001 to 89 μg/m3 in 2010, which – as a matter of fact – is still very high for Western standards. It has been estimated that the DALYs (Disability-Adjusted Life Years) lost in Shanxi had decreased by 56.92% as a consequence of the measures (Tang et al, 2014).  The IPCC 5th assessment report stresses that the main health co-benefits from climate change mitigation policies come from substituting polluting sources of energy for renewable and cleaner sources, with a considerable effect on the improvement of air quality.


Practical conclusions

The co-benefits from climate change mitigation for the health sector have not yet been completely identified and quantified. The topic does not appear on the priority list of political discourse: relevant sectors, including those involved in non-communicable disease prevention (Pearce et al, 2014), transportation, agriculture, food production and climate change (Alleyne et al, 2013), still work separately, while collaboration would improve the synergy between health improvement and climate change mitigation and maximise benefits for both.


References

Alleyne G, Binagwaho A, Haines A, Jahan S, Nugent R, Rojhani A, Stuckler D; Lancet NCD Action Group. Embedding non-communicable diseases in the post-2015 development agenda. Lancet. 2013 Feb 16;381(9866):566-74. doi: 10.1016/S0140-6736(12)61806-6

Friel S, Dangour AD, Garnett T, Lock K, Chalabi Z, Roberts I, Butler A, Butler CD, Waage J, McMichael AJ, Haines A.  Public health benefits of strategies to reduce greenhouse-gas emissions: food and agriculture.  Lancet 2009; 374: 2016-25.

Gordon SB, Bruce NG, Grigg J, Hibberd PL, Kurmi OP, Lam KB, Mortimer K, Asante KP, Balakrishnan K, Balmes J, Bar-Zeev N, Bates MN, Breysse PN, Buist S, Chen Z, Havens D, Jack D, Jindal S, Kan H, Mehta S, Moschovis P, Naeher L, Patel A, Perez-Padilla R, Pope D, Rylance J, Semple S, Martin WJ 2nd. Respiratory risks from household air pollution in low and middle income countries. Lancet Respir Med. 2014 Oct;2(10):823-60. doi: 10.1016/S2213-2600(14)70168-7

Haines A, McMichael AJ, Smith KR, Roberts I, Woodcock J, Markandya A, Armstrong BG, Campbell-Lendrum D, Dangour AD, Davies M, Bruce N, Tonne C, Barrett M, Wilkinson P. Public health benefits of strategies to reduce greenhouse-gas emissions: overview and implications for policy makers. Lancet. 2009 Dec 19;374(9707):2104-14. doi: 10.1016/S0140-6736(09)61759-1. Epub 2009 Nov 26.

Pearce N, Ebrahim S, McKee M, Lamptey P, Barreto ML, Matheson D, Walls H, Foliaki S, Miranda J, Chimeddamba O, Marcos LG, Haines A, Vineis P. The road to 25×25: how can the five-target strategy reach its goal? Lancet Glob Health. 2014 Mar;2(3):e126-8. doi: 10.1016/S2214-109X(14)70015-4.

Tang D, Wang C, Nie J, Chen R, Niu Q, Kan H, Chen B, Perera F; Taiyuan CDC. Health benefits of improving air quality in Taiyuan, China. Environ Int. 2014 Dec;73:235-42. doi: 10.1016/j.envint.2014.07.016. Epub 2014 Aug 27.

Wilkinson P, Smith KR, Davies M, Adair H,  Armstrong BG, Barrett M, Bruce N, Haines A, Hamilton I, Oreszczyn T,  Ridley I, Tonne C and Chalabi Z. Public health benefits of strategies to reduce greenhouse-gas emissions: household energy. 2009. The Lancet, 374: 9705 (P1917 – 29)

World Cancer Research Fund. Recommendations Booklet. Available from:  http://www.wcrf.org/

Woodcock J, Edwards P, Tonne C, Armstrong BG, Ashiru O, Banister D, Beevers S, Chalabi Z, Chowdhury Z, Cohen A, Franco OH, Haines A, Hickman R, Lindsay G, Mittal I, Mohan D, Tiwari G, Woodward A, Roberts I. Public health benefits of strategies to reduce greenhouse-gas emissions: urban land transport. Lancet. 2009 Dec 5;374(9705):1930-43. doi: 10.1016/S0140-6736(09)61714-1. Epub 2009 Nov 26.

With climate models, simpler isn’t necessarily better

Grantham Institute Co-Director Professor Joanna Haigh discusses a recent paper which argues that  existing climate models ‘run hot’ and overstate the extent of manmade climate change.

Retro filtered picture of smoky chimneys silhouettes against sunIt is perplexing that some climate change sceptics, who expend much energy in decrying global circulation (computer) models of the climate, on the basis that they cannot properly represent the entire complexities of the climate system and/or that they contain too many approximations, are now resorting to an extremely simplified model to support their arguments.

The model used in the Sci. Bull. article is a very useful tool for conceptualising the factors which contribute to the relationship between increasing concentrations of carbon dioxide in the atmosphere and global average temperature – indeed, we use such models as teaching aids for students studying atmospheric physics – but it is in no way fit for purpose as an accurate predictor of climate change.  It requires as input the values of a number of parameters and, fundamentally, the choice of these values determines the predicted temperatures

Key here is the “feedback parameter” which represents the knock-on effects of changes in the atmosphere on the initial response to greenhouse gas warming.  A positive feedback will make the temperature change larger and a negative one reduce it.  For example, as the atmosphere warms it can hold more water vapour which itself is a greenhouse gas, acting to enhance the initial carbon dioxide-induced warming and thus giving a positive feedback.  The physics of this process is very well-understood.  There are a number of other, both positive and negative, feedback processes but overall, analyses of meteorological observations, modelling and understanding of the physical processes point to a significantly positive value.  In the present paper the authors choose a very small value, based on temperatures measured in ice cores over the 810,000 year period of ice ages and inter-glacials.  Their analysis is incomplete but anyway not relevant to changes in global climate over decadal-to-century timescales.

Thus by choosing an inappropriate value of the feedback parameter, and also judicious choices of other parameters, the authors end up with their “models run hot” conclusion.  Must try harder.

Internship Experiences: Skidmore, Owings & Merrill

The Climate and Environment at Imperial blog has moved. View this post on our new blog

by Peter Blair, Science and Solutions for a Changing Planet DTP student

Thames-Basin
The Thames Basin, a Map Highlighting Urban Areas

The Thames Basin is set to face many challenges in the future: climate change, a growing population and economic requirements all present developmental challenges, as well as major sources of uncertainty. Having previously worked on a voluntary project producing a vision for planning in the Great Lakes Basin over the next hundred years, Skidmore Owings and Merrill (SOM) were interested in applying the same methodology to the Thames Basin to determine how we may best plan for the future in this area.

During the summer of 2014, prior to starting the NERC Science and Solutions for a Changing Planet Doctoral Training Partnership at Imperial College, I undertook the exciting opportunity of an internship with Skidmore, Owings and Merrill, looking at the future of planning of development in the Thames Basin.

Who are SOM?

SOM, short for Skidmore, Owings and Merrill, are a world-leading firm of architects, structural engineers and urban planners. They have designed buildings such as the Burj Khalifa and the Broadgate Tower (where their London office is now based), and have worked on the Imperial College Campus master plan, amongst many other projects.

What did I do?

I used SOM’s Great Lakes investigation as an inspiration for looking at planning in the Thames Basin, identifying the assets that the basin has, for example extensive infrastructure, a thriving economy, a history of innovation and a rare depth of culture, the issues that it faces, including overcoming archaic governance boundaries, managing water in the face of both drought and flood, and coping with the change and uncertainty that climate change brings. I produced a booklet identifying first ideas for a vision of what planning in the Thames Basin could be built around in the future. Elements of this vision include integrating the various planning documents that exist into a more cohesive, basin-level plan, recognition of the positive feedback cycles that exist between ‘green’ and ‘blue’ policies and using infrastructure to develop a holistically connected basin.

What did I gain?

I had a fantastic time at SOM: I met a lot of great people with amazing ideas and skills, and was also able to develop myself while there. The internship gave me the freedom and time to develop new skills that are hugely useful, but which I would probably not have had the opportunity to investigate otherwise. One example would be ArcGIS, which allows for the creative display of map-based data, and which I will be able to utilise as part of my PhD, but which I may never otherwise have had to opportunity to learn. I was also able to ‘dip my toe’ into the corporate environment, without having to jump straight in. This showed me the different emphasis which is placed on various aspects of work in business compared to academia: the importance of delivering a positivist message and looking at the big picture, distilling a great amount of information into a short message and using images to convey meaning.

What did SOM gain?

Hopefully SOM feel as though they have gained from my undertaking of this internship as well. As I was a short-term member of the team, SOM were able to work on a different kind of project that was perhaps less corporate and which required different skills. While many other members of the team were working on multiple projects at any one time, I was also able to give my focussed attention to the Thames Basin project. This internship has also strengthened the link between SOM and Imperial College, and building links with academia is something that SOM have been very keen to do.


Find out more about Peter’s PhD project

2014 – the warmest year on record

Thermometer2A summary of global temperature for 2014 from NASA and NOAA has just been published, showing that the average global temperature for 2014 was 0.69°C above the average for the 20th century. The small margin of uncertainty in calculating average global temperature means that the exact ranking of 2014 cannot be distinguished from the previous record years of 2005 and 2010, but it is nominally the warmest year on record. The ten warmest years have all occurred since 1998.

Professor Jo Haigh, Co-Director of the Grantham Institute, commented on the report saying that: “This and other indicators are all pointing in the same direction of continued global warming, reflecting the overall upward trend in average global temperatures”

A large amount of warming was seen in the oceans with globally-averaged sea surface temperature 0.57°C above the 20th century average. This is consistent with recent studies that have suggested that much of the extra energy in the Earth system is going in to the oceans. You can read more about the significance of ocean heat uptake in our blog post.

An update from the Met Office on global temperatures is expected later this month and we look forward to seeing the further detail that this will add.

See the full report on the NOAA website.

Who’s responsible for tackling climate change? – COP 20 outcomes

Smog in guangzhou1000
Smog in Guangzhou, China

By Dr Flora WhitmarshGrantham Institute

An agreement produced by the 20th Conference of the Parties in Lima, Peru, noted ‘with grave concern’ that countries’ current pledges on emissions reductions are insufficient to keep global temperature rise within either 2°C or 1.5°C of pre-industrial levels. This is indeed a serious concern because temperature changes of just a few degrees are enough to change the climate significantly. Rising sea levels, melting mountain glaciers and polar ice caps and increases in extreme precipitation have already been observed. These trends will continue with ongoing greenhouse gas emissions, and it is expected that we will continue to see an increase in extreme high sea levels, an increase in the intensity of the heaviest rain, and changes in the global distribution of rainfall.

The Parties to the United Nations Framework Convention on Climate Change (UNFCCC) have until March 2015 to provide updated emissions pledges. The 1994 UNFCCC protocol aims to achieve the ‘stabilization of greenhouse gas concentrations in the atmosphere at a level that would prevent dangerous anthropogenic interference with the climate system’. The protocol made it clear that countries have ‘common but differentiated responsibilities and respective capabilities’, implying that developed nations who are responsible for historical emissions should make the deepest cuts. An agreement drafted during COP 20 added the phrase ‘in light of different national circumstances’. The new deal to some extent blurs the distinction that has existed between developed and developing nations. However, it remains to be seen exactly how the responsibility to reduce emissions will be spread between different countries.

China’s per capita emissions are now at EU levels, but when total cumulative emissions of greenhouse gases are taken into account – carbon dioxide is long lived in the atmosphere so the total emissions over time are what matter – the five countries most responsible for global warming on a per capita basis are the United Kingdom, the United States, Canada, Russia and Germany. When countries are ranked by their absolute contribution to global warming so far, the top five are the United States, China, Russia, Brazil and India, and the United Kingdom is number seven on the list. Of course, the reason for the United Kingdom’s high ranking on both these lists because it industrialised early. Different studies disagree on the exact ranking, but on a per capita basis the developed nations bear most of the responsibility for the temperature increases we have already seen. Nevertheless, there is increasingly a need for the richer developing nations to take some action as well.

The coming months are a critical time for the global climate change negotiations. There have already been encouraging signs: the United Kingdom and the EU have led the way with ambitious pledges, and China and the United States have taken a positive step forward with their recent bilateral agreement. However, more needs to be done. It is right that the United Kingdom and the EU are leading the way on this, but it is also vital that the political will remains to tackle climate change as we move into a crucial stage of the negotiations. Action is urgently needed – in order to avoid temperatures rising more than 2°C above pre-industrial levels, global emissions should peak by 2020. Delaying the peak in emissions until 2030 will increase the costs of taking action and make it very difficult to keep to this target. Meeting the 2°C target will require the leaders of the developed world to continue to increase the level of ambition over the coming months.

Climate change: positive messages on the international scene

By Dr Flora WhitmarshGrantham Institute

This blog forms part of a series addressing some of the criticisms often levelled against efforts to mitigate climate change.

smoke stacksThe Twentieth Session of the Conference of the Parties (COP 20) – the latest in a series of meetings of the decision making body of the UN Framework Convention on Climate Change –began in Lima this week. Many in the media are quick to point to the difficulty of obtaining international agreement on greenhouse gas emissions reductions, and to denounce COP 15, which took place in Copenhagen in 2009, as a failure. Far from being a failure, the Copenhagen meeting paved the way for future climate change action. World leaders agreed ‘that climate change is one of the greatest challenges of our time’ and emphasised their ‘strong political will to urgently combat climate change in accordance with the principle of common but differentiated responsibilities and respective capabilities’, and it was agreed that ‘deep cuts in global emissions are required’. The Copenhagen accord also said that a new Copenhagen Green Climate Fund would be established to support developing countries to limit or reduce carbon dioxide emissions and to adapt to the effects of climate change.

The last objective is in progress: the green climate fund was set up at COP 16, held in Cancun, Mexico in 2010, and several major countries have pledged money. Japan has pledged $1.5 billion, the US has pledged $3 billion, Germany and France have pledged $1 billion each, the UK pledged $1.13 billion and Sweden pledged over $500m. This brings us close to the informal target of raising $10 billion by the end of the year. The goal is to increase funding to $100 billion a year by 2020. There have also been several smaller donations. This is a key step in tackling climate change, because the gap between developed and developing countries in their ability to respond to climate change and their level of responsibility for causing the problem must be addressed.

Obtaining international agreement to reduce emissions is a real challenge. It is not surprising that it is difficult to reach consensus on a course of action between a large range of different countries at different stages of development who bear differing levels of responsibility for greenhouse gas emissions to date: the UN Framework Convention on Climate Change has 196 Parties. However, there has been significant progress towards global emissions reductions, led by the EU, China and the US.

UK commitments

Prior to the Copenhagen COP, the UK Climate Change Act was passed in 2008, and contains a legally binding commitment to reduce UK emissions by at least 80% on 1990 levels by 2050. In addition, the UK Committee on Climate Change has recommended an emissions reduction of 50% on 1990 levels by 2025 in order to meet the longer term target. Some have argued that by taking unilateral action, the UK put itself at risk of losing out economically to countries that had not made such pledges. Competitiveness concerns have been evaluated by the Committee on Climate Change, the body set up as part of the Climate Change Act to advise the UK government on emissions targets. The committee found that ‘costs and competitiveness risks associated with measures to reduce direct emissions (i.e. related to burning of fossil fuels) in currently legislated carbon budgets are manageable.’ Continued support from the EU emissions trading scheme may be needed in the 2020s, but this depends on progress towards a global deal.

By making this commitment the UK has been able to enter into negotiations with other countries from a position of strength. The UK is one of the leading historic emitters of carbon dioxide – it is, of course, the sum total of our emissions beginning in the industrial revolution that will, to a good approximation, determine humanity’s impact on the climate, not the emissions in any given year – and therefore it is right that the UK took the lead by making this commitment. Had we not made such a pledge, it would have put us in a more difficult position when negotiating with other countries, particularly those still on the path to development.

EU pledges

The UK is not now acting alone – other major countries have recently made significant emissions reduction pledges. The recent European Council agreement that the EU should cut emissions by 40% on 1990 levels by 2030 represents a step forward. It was decided that all member states should participate, ‘balancing considerations of fairness and solidarity.’ It was also decided that 27% of energy consumed in the EU should be from renewable sources by 2030, and a more interconnected European energy market should be developed to help deal with the intermittency of renewable sources of energy.

The EU target is still not quite as ambitious as the UK target. However, this latest EU agreement is a significant step in the right direction and demonstrates that international cooperation on a large scale is possible, albeit within a body like the EU with pre-existing economic ties. In addition, it generally costs more to cut emissions the faster the cuts are implemented. If the world is genuine in its commitment to tackling climate change, very significant emissions reductions are ultimately required, and delaying action means having to cut emissions more quickly at a later date – at a higher cost. In addition, the Committee on Climate Change found that despite short term increases in electricity prices, early action means that UK electricity prices are projected to be lower in the medium term compared to a fossil fuel intensive pathway, assuming there is an increase in the carbon price in the future.

China and the US

A recent development is the bilateral agreement between China and the US. China stated that its emissions would peak by 2030, by which time the country aims to get 20% of its energy from non-fossil fuel sources, and the US pledged to reduce its emissions by 26%-28% on 2005 levels by 2025. Some have suggested that the agreement does not go far enough because China’s emissions will continue to rise until 2030 under the deal, and the US target is not as stringent as the EU or UK targets. However, these pledges coming in the lead up to Lima from the two largest emitters globally are hugely significant, and pave the way for further progress.  China has already made significant progress in reducing the energy intensity (energy per unit of GDP) of its economy: the 11th Five Year Plan, covering the period 2006-2010 aimed to reduce energy intensity by 20%, and achieved a reduction of 19.1%. Despite some disruption to the energy supply, this success in meeting the target demonstrates the Chinese government’s track record of achieving its objectives on green growth. The current five year plan aims to cut energy intensity and carbon intensity (carbon emissions per unit of GDP) by a further 16% and 17% respectively on 2010 levels by 2015. It is right that developing countries should be able to grow their economies – China’s per capita GDP is still relatively low – and this has to be balanced with climate change targets.

The EU, China and the US together accounted for just over half of total global carbon dioxide emissions in 2013. Their pledges demonstrate that smaller groups of countries made up of the major emitters can make a difference without waiting for far-reaching international agreement on emissions reductions. Their willingness to act also has the potential to spur other industrialised countries into reducing their own emissions. More action is still needed, but there has been significant progress since the Copenhagen conference, which should pave the way for more ambitious pledges.

Why subsidise renewable energy?

by Ajay Gambhir, Grantham Institute

This blog forms part of a series addressing some of the criticisms often levelled against efforts to mitigate climate change.


It is often claimed that intermittent renewable sources of electricity (mainly wind and solar photovoltaics), are too expensive, inefficient and unreliable and that we shouldn’t subsidise them.

Wind turbines at a burning sunsetWhat are the facts?

Last year, governments spent about $550 billion of public money on subsidies for fossil fuels, almost twice as much as in 2009 and about five times as much as they spent subsidising renewables (IEA, World Energy Outlook 2014). This despite a G20 pledge in 2009 to “phase out and rationalize over the medium term inefficient fossil fuel subsidies” that “encourage wasteful consumption, reduce our energy security, impede investment in clean energy sources and undermine efforts to deal with the threat of climate change”.

Reducing the cost of renewables

There is a key reason why it makes sense to subsidise the deployment of renewable energy technologies instead of fossil fuels. They are currently more expensive than established fossil fuel sources of power generation such as coal- and gas-fired power stations, because the scale of the industries that produce them is smaller and because further innovations in their manufacture and deployment are in the pipeline. As such there needs to be a period of translating laboratory-stage innovations to the field, as well as learning and scaling-up in their manufacture, all of which should bring significant cost reductions. This is only likely to be possible with either:

  • a) a long-term, credible carbon price at a sufficient level to make the business case for developing and deploying renewable energy technologies instead of CO2-emitting technologies; or
  • b) some form of subsidy in the short to medium term, which creates a market for these technologies and provides businesses operating in a less-than-certain policy environment with the incentive to build industrial scale manufacturing plants to produce them (ever more economically as scale and learning effects take hold).

Unfortunately, there is unlikely to be a long-term, credible and significant (“long, loud and legal”) carbon price anytime soon, given the immense political lobbying against action to tackle climate change, and the lack of global coordinated emissions reduction actions, which means any region with a higher carbon price than others puts itself at risk of higher energy prices and lost competitiveness. Whilst subsidies are also likely to raise energy prices, their targeting at specific technologies (often under some fiscal control such as the UK’s levy control framework) means they should have less overall impact on prices. In addition, subsidies have helped to put some technologies on the energy map faster than a weak carbon price would have done and have given a voice to new energy industries to counter that of the CO2-intensive incumbents.

Nevertheless, subsidies should not remain in place for long periods of time, or at fiscally unsustainable levels. Unfortunately some countries, such as Spain, have fallen into that trap, with an unexpectedly high deployment of solar in particular leading to a backlash as fiscal costs escalated, rapid subsidy reductions and the stranding of many businesses engaged in developing these technologies. Germany’s subsidy framework for solar, with its longer term rules on “dynamic degression” levels (which reduce over time depending on deployed capacity in previous years) has proven a better example of balancing the incentive to produce and deploy new technologies with the need to manage fiscal resources carefully (Grantham Institute, 2014).

Reaching grid parity

Fortunately, the price of solar and onshore wind has fallen so much (through manufacturing and deployment scale-up and learning that the subsidies were aimed at in the first place) that they are now approaching or have achieved “grid parity” in several regions – i.e. the same cost of generated electricity as from existing fossil fuel electricity sources. Analysis by Germany’s Fraunhofer Institute shows that solar PV, even in its more expensive form on houses’ rooftops, will approach the same level of electricity generation cost as (hard) coal and gas power stations in Germany within the next decade or so, with onshore wind already in the same cost range as these fossil fuel sources.  Subsidies should be phased out as the economics of renewables becomes favourable with just a carbon price (which should be set at a level appropriate to reducing emissions in line with internationally agreed action to avoid dangerous levels of climate change).

It’s important to note that grid parity of electricity generation costs does not account for the very different nature of intermittent renewables compared to fossil fuel power stations, which can very quickly respond to electricity demand peaks and troughs and help ensure that electricity is available as required. For example one common contention is that for every unit of solar capacity in northern latitudes, significant back-up of fossil fuel generation (most often gas turbines, which are quick to ramp up) is required to meet dark winter peak demand in the evenings. Indeed, analysis by the US Brookings Institute based on this principle (as given much publicity in The Economist in July 2014) suggested this would make solar PV and wind much more expensive than nuclear, gas and hydro power.

Unfortunately, and as reflected in the published responses to the Economist article, this analysis has proven to be too simplistic: not accounting for the fact that wind and solar provide complementarities since the wind often blows when the sun’s not shining; that electricity grids can span vast distances (with high voltage direct current lines) which effectively utilise wind and sunlight in different regions at different times; that there is a great deal of R&D into making electricity storage much cheaper; that electricity networks are going to become “smarter” which means they can more effectively balance demand and supply variations automatically; and that the costs of these renewable technologies are coming down so fast that (particularly in the case of solar) its economics might soon be favourable even with significant back-up from gas generation.

In summary, the world is changing, electricity systems are not what they once were, and there is a very sound economic case for meeting the challenge of climate change by deploying low-carbon renewable electricity sources. It is encouraging to see that there has been a rapid rise in the deployment of these technologies over the past decade, but more needs to be done to ensure that the low-carbon world is as low-cost as possible. This means supporting and therefore continuing to subsidise these critical technologies to at least some extent.


References

International Energy Agency (2014) World Energy Outlook 2014

Statement from the G20 in Pittsburgh, 2009, available at: https://www.g20.org/sites/default/files/g20_resources/library/Pittsburgh_Declaration.pdf

Grantham Institute, Imperial College London (2014) Solar power for CO2 mitigation, Briefing Paper 11, available at: https://workspace.imperial.ac.uk/climatechange/Public/pdfs/Briefing%20Papers/Solar%20power%20for%20CO2%20mitigation%20-%20Grantham%20BP%2011.pdf

Fraunhofer Institute (2013) Levelized cost of Electricity: Renewable Energy Technologies, available at: http://www.ise.fraunhofer.de/en/publications/veroeffentlichungen-pdf-dateien-en/studien-und-konzeptpapiere/study-levelized-cost-of-electricity-renewable-energies.pdf

The Economist (2014a) Sun, Wind and Drain, Jul 26th 2014, available at: http://www.economist.com/news/finance-and-economics/21608646-wind-and-solar-power-are-even-more-expensive-commonly-thought-sun-wind-and

The Economist (2014b) Letters to the editor, Aug 16th 2014, available at: http://www.economist.com/news/letters/21612125-letters-editor

How will Antartica’s ice-sheet contribute to 21st century sea level rise?

by Professor Martin Siegert, Co-director, Grantham Institute

Antarctic glacierOn 27th October I convened a meeting at the Royal Society of London to discuss the results of a recent 20-year research horizon scanning exercise for Antarctic Science (Kennicutt et al. 2014). Part of the discussion focused on the research needed to better quantify Antarctica’s likely contribution to sea level rise in the coming decades and beyond, as published in the new Intergovernmental Panel on Climate Change (IPCC) Synthesis Report.

The report states that, ‘Global mean sea level rise will continue during the 21st century, very likely at a faster rate than observed from 1971 to 2010, and will likely be in the ranges of 0.26 to 0.55 m [in the lowest emissions scenario] … and … 0.45 to 0.82 m [in the highest emissions scenario – the closest to “business as usual”]’. It also states that, ‘Based on current understanding, only the collapse of marine-based sectors of the Antarctic ice sheet, if initiated, could cause global mean sea level to rise substantially above the likely range during the 21st century.’ There is medium confidence that any additional sea level rise would be no more than tens of centimetres.

One of the speakers at the event, Prof. David Vaughan, the Director of Research at the British Antarctic Survey, supported the IPCC’s position by remarking that he knew of no glaciologist who would strongly advocate a different position to this, given the evidence at hand. As a glaciologist myself, I can easily accept Prof. Vaughan’s comment and I don’t believe it is controversial among the community. I was, however, provoked by it to consider the relevant issues a little further, given the uncertainties noted by the IPCC, and to take the opportunity to discuss it with colleagues at the meeting.

  Could ice sheet collapse lead to further sea level rise?

Historically, ice sheet responses to global warming have been responsible for sea level changes of a metre or more per century. As the glaciers retreated after the last ice age, sea levels rose by an average of over a metre per century between 20,000 years ago and 10,000 years ago – a total of 120 m. Records also show that the rate of sea level rise can exceed this, however. During the so-called ‘meltwater pulse 1a’ (MWP1a) episode around 15,000 years ago, an increase of around 7 m per century took place. The cause of MWP1a remains uncertain, with some pointing to the rapid decay of the North American ice sheet, whereas others link the change to Antarctica. It may be that both ice sheets were involved to some degree, and the details of the issue remain hotly debated. The point to note is that changes in the cryosphere are certainly capable of causing global sea level to rise at a higher rate than the IPCC suggests.

It is worth considering  whether we can rule out the possibility of a new meltwater pulse being locked in somewhere in Antarctica or Greenland, ready to be released to the ocean once some threshold has been reached. As the IPCC notes, several regions of the West Antarctic ice sheet (in particular) and East Antarctic ice sheet appear close to or at a physical threshold of change, where ground ice retreat into deeper (below sea level) terrain leads to further accelerated loss of ice to the sea (often referred to as marine ice sheet instability). Papers earlier this year by Joughin et al. (2014) and Rignot et al. (2014) point to such irreversible change having already begun in the Amundsen Bay region of West Antarctica. According to Joughin et al. (2014) the full effects of such change may take several hundred years, in line with the IPCC’s position. Evidence from the other side of West Antarctica demonstrates a region the size of Wales being highly sensitive to future ocean warming (Ross et al. 2012), and that such warmth may be delivered within a few decades (Hellmer et al. 2012). Across the continent in East Antarctica, the structure of the underlying bedrock reveals evidence of major ice recession in the past (Young et al. 2011), hinting that the ice sheet response to warming is not necessarily restricted to West Antarctica. Indeed while West Antarctica may be losing mass more quickly than anywhere else on the planet, the greatest potential for sea level change lies in East Antarctica, which about ten times greater in volume.

So, after considering Prof. Vaughan’s point that no glaciologist would differ markedly from the IPCC on Antarctic ice sheet collapse, I returned a question to him and those gathered: how can we be sure that the Antarctic ice sheet won’t respond to ocean warming more quickly than expected in certain regions? The answer is we can’t be certain even though, like Joughin et al. (2014), we may consider it unlikely. While I did not dispute Prof. Vaughan’s point, in the light of both recent findings and more established figures on how ice sheets can change during episodes of global warming, there is surely a non-zero risk of much greater sea level rise over the coming decades than the IPCC alludes to.

Quantifying this risk is difficult – maybe impossible at present – and as a consequence is likely to be highly controversial, which is why the IPCC does not tackle it. The problem is that quantifying a non-zero risk of global sea level rise over 1 m in the next 100 years is a far more challenging problem – for both scientists and decision makers – than restricting the debate to what we consider most likely. Maintaining this restriction on the debate is neither safe nor sensible, however.

Glaciologists will point to the research needed on the Antarctic ice sheet’s sensitivity to ocean warming to advance the debate. In 20 years as a glaciologist, I have been surprised on numerous occasions by what we discover about the flow and form of past and present ice sheets. I am utterly certain that amazing new discoveries lie ahead. For this reason, an appropriately sceptical scientific attitude is to accept that our knowledge of Antarctica remains woefully inadequate to be certain about future sea level rise, and to always challenge the consensus constructively.

The solution lies in our ability to model the ice-ocean system in a way that allows confident predictions of the ice sheet response to ocean warming. To do this we need two things. First is better input data, by way of high-precision landscaping beneath the ice sheet in regions most sensitive to change, and in areas where no data have been collected (and there are several completely unexplored parts of the continent). The data collected would also allow us to better understand the process of ice flow in key regions of potential change. A second advance needed is in the coupling of ice-sheet and ocean models. Both are challenging, but well within our abilities to achieve them. Indeed the horizon scanning exercise discussed last week made such investigations a priority.

The costs of decarbonising the UK

By Dr Flora WhitmarshGrantham Institute

money200The costs associated with reducing emissions in the UK have been discussed recently in the press. In an article in the Mail on Sunday, David Rose made the claim that energy policies shaped by the so-called “Green Blob” –  a term coined by Owen Paterson for what he called “the mutually supportive network of environmental pressure groups, renewable energy companies and some public officials” – will cost the UK up to £400 billion by 2030, and that bills will rise by at least a third.

How much will action on climate change actually cost? The quoted figure of £400 billion equates to 1-1.5% of cumulative UK GDP over the next sixteen years. The most recent analysis to be carried out by the Intergovernmental Panel on Climate Change suggests that the costs of a low carbon economy would be around 1-4% of GDP globally by 2030. Analysis carried out by the AVOID consortium which includes Grantham Institute researchers found that the costs of staying within 2oC were 0.5-4% of global GDP, and a report on the costs of mitigation co-authored by the Grantham Institute put the costs at around 1% of global GDP. The figure quoted in the Mail on Sunday for the overall costs of decarbonisation is of the order of magnitude projected by experts, but these figures do not take into account the co-benefits of mitigation such as improved air quality and energy security. In fact a recent report by Cambridge Econometrics asserts that the UK’s decarbonisation pathway would lead to a net increase in GDP of 1.1% by 2030, due to structural changes in the economy and job creation resulting from the low-carbon transition.

Whilst these estimates relate to the economy-wide cost of using low-carbon energy rather than carbon-intensive sources such as fossil fuels, it is not immediately clear from them what this means for the cost of living. The rising cost of household energy is a key concern for people in the UK who have already seen significant increases in the average bill since 2004 mainly due to the rising cost of gas. In a report published in 2012, the Climate Change Committee concluded that support for low carbon technologies would add an average of £100 (10%) onto energy bills for a typical household by 2020 – where a typical household is one that uses gas for heating, and electricity for lighting and appliances. A further increase of £25 per household is projected by 2030, but this is less than in a scenario with high levels of investment in gas-fired power generation.

Furthermore, this could be partially offset by improvements in energy efficiency. The Climate Change Committee expects that by 2020 the replacement of old inefficient boilers will reduce bills by around £35 on average. The use of more efficient lights and appliances could reduce bills by a further £85, and improved efficiency in heating, mainly due to insulation, could save another £25 on average. However, making these savings would depend on having the right policies in place to encourage energy efficiency.

In defence of biomass energy

By Professor Colin Prentice, AXA Chair in Biosphere and Climate Impacts

Further to previous posts on this blog regarding Owen Paterson’s recent speech to the Global Warming Policy Foundation, I would like to take this opportunity to correct his dismissive statement about biomass energy as a potential contribution to decarbonized energy production in the UK. This is what the former Environment Secretary said:

forest-272595_1280

Biomass is not zero carbon. It generates more CO2 per unit of energy even than coal. Even DECC admits that importing wood pellets from North America to turn into hugely expensive electricity here makes no sense if only because a good proportion of those pellets are coming from whole trees.

The fact that trees can regrow is of little relevance: they take decades to replace the carbon released in their combustion, and then they are supposed to be cut down again. If you want to fix carbon by planting trees, then plant trees! Don’t cut them down as well. We are spending ten times as much to cut down North American forests as we are to stop the cutting down of tropical forests.

Meanwhile, more than 90 percent of the renewable heat incentive (RHI) funds are going to biomass. That is to say, we are paying people to stop using gas and burn wood instead. Wood produces twice as much carbon dioxide than gas.

There are two misconceptions here.

(1) It is extremely relevant that ‘trees can regrow’ – this is the whole reason why biomass energy is commonly accounted as being carbon neutral! To be genuinely carbon neutral, of course, every tonne of biomass that is burnt (plus any additional greenhouse gas emissions associated with its production and delivery to the point of use) has to replaced by a tonne of new biomass that is growing somewhere else. This is possible so long as the biomass is obtained from a sustainable rotation system – that is, a system in which the rate of harvest is at least equalled by the rate of regrowth, when averaged over the whole supply region.

Now it has been pointed out several times in the literature (e.g. Searchinger et al., 2009; Haberl et al., 2012) that if biomass is burnt for energy and not replenished (for example, if trees are cut down and the land is then converted to other uses), then it is not carbon neutral. Indeed, the carbon intensity of this form of energy production is at least as high as that of coal. Paterson may have been influenced by a report on this topic (RSPB, Friends of the Earth and Greenpeace, 2012) which drew attention to the “accounting error” by which energy derived from biomass might be classed as carbon neutral while actually being highly polluting. But this refers to an extreme scenario, whereby increased demand for forest products leads to no increase in the area covered by forests. In this scenario, biomass energy demand would have to be met from the existing (global) forest estate, drawing down the carbon stocks of forests and forcing builders to substitute concrete and other materials for wood. This would certainly be undesirable from the point of view of the land carbon balance; and carbon accounting rules should recognize the fact.

Nonethless, this extreme scenario is implausible. It assumes that the value of biomass as fuel would be comparable to that of timber (highly unlikely) and more generally that there would be no supply response to increased demand. In more economically plausible scenarios, the increased demand for biomass fuel is met by an increase in the use of by-products of timber production (which today are commonly left to decay or burnt without producing any energy), and by an increase in the amount of agriculturally marginal land under biomass production – including non-tree energy crops such as Miscanthus, as well as trees.

Paterson’s blanket dismissal of the potential for biomass production to reduce CO2 emissions is therefore not scientifically defensible. Sustainable biomass energy production is entirely possible, already providing (for example) nearly a third of Sweden’s electricity today. It could represent an important contribution to decarbonized energy production in the UK and elsewhere.

(2) It might seem to be common sense that planting trees (and never cutting them down) would bring greater benefits in extracting CO2 from the atmosphere than planting trees for harvest and combustion. All the same, it is wrong. The point is that just planting trees produces no energy, whereas planting trees for biomass energy production provides a substitute for the use of fossil fuels. There is an enormous difference. Indeed, it has been known for a long time that the total reduction in atmospheric CO2 concentration that could be achieved under an absurdly optimistic scenario (converting all the land that people have ever deforested back into forests) would reduce atmospheric CO2 concentration by a trivial amount, relative to projected increases due to burning fossil fuel (House et al., 2002; Mackey et al. 2013).

I thank Jeremy Woods (Imperial College) and Jonathan Scurlock (National Farmers Union) for their helpful advice on this topic, and suggestions to improve the text.


  References

Haberl, H. et al. (2012) Correcting a fundamental error in greenhouse gas accounting related to bioenergy. Energy Policy 45: 18-23.

House, J.I., I.C. Prentice and C. Le Quéré (2002). Maximum impacts of future reforestation or deforestation on atmospheric CO2. Global Change Biology 8: 1047-1052.

Mackey, B. et al. (2013) Untangling the confusion around land carbon science and climate change mitigation policy. Nature Climate Change 3: 552-557.

RSPB, Friends of the Earth and Greenpeace (2012) Dirtier than coal? Why Government plans to subsidise burning trees are bad news for the planet. http://www.rspb.org.uk/Images/biomass_report_tcm9-326672.pdf

Searchinger, T. et al. (2009) Fixing a critical climate accounting error. Science 326: 527-528.


Has climate change been exaggerated? Fact-checking Owen Paterson’s comments

By Dr Flora WhitmarshGrantham Institute

tropical storm 250In a lecture to the Global Warming Policy Foundation, the former UK Environment Secretary Owen Paterson has criticised the current government’s climate and energy policies, suggesting there is too much emphasis on renewables and that the consequences of climate change have been exaggerated. A discussion of Mr Paterson’s comments on UK energy policy appears in another Grantham blog by Dr Simon Buckle. Here I will discuss one of the reasons for Paterson’s position, the belief that climate change has been exaggerated.

Paterson suggested that the Earth has not warmed as much as had been predicted, “ … I also accept the unambiguous failure of the atmosphere to warm anything like as fast as predicted by the vast majority of climate models over the past 35 years, when measured by both satellites and surface thermometers. And indeed the failure of the atmosphere to warm at all over the past 18 years – according to some sources. Many policymakers have still to catch up with the facts.”

If we look back to earlier attempts to quantify global warming, it is now becoming clear that while these attempts were not perfect, they were not hugely inaccurate either. Natural climate variation is more significant than global warming over shorter time periods, but about 25 years have now passed since the earliest attempts to produce policy-relevant projections of rate of warming, and subsequent publications have started to assess how accurate these projections were.

Early climate projections

In late 2013, the Intergovernmental Panel on Climate Change (IPCC), a body reporting to the UN, released the first volume of its Fifth Assessment Report. This volume contained an in-depth summary of scientific knowledge about climate science. Scientific understanding of the climate has come a long way since the IPCC released their First Assessment Report in 1990, but the basics of the greenhouse effect were well understood at the time. The projections of future temperature rise in the 1990 report represent the earliest attempt to produce a scientific consensus of opinion regarding the severity of global warming.

A paper published in 2010 by Frame and Stone checked the projections in the First IPCC Report against observed temperature rise.  Under the “business as usual” emissions scenario, the IPCC’s best estimate for the projected temperature increase between 1990 and 2010 was 0.55C, within a range of uncertainty. According to two different data sets, temperatures actually increased by 0.35C (HadCRUT3) or 0.39C (GISTEMP) during that period. This is just outside the broader range given by the IPCC, but the IPCC’s range was intended to reflect the uncertainty in the effects of greenhouse gases emissions on the long term warming trend. No attempt was made to include natural climate variability. Frame and Stone performed calculations to account for natural variability using two plausible methods. Both methods showed that the measured temperature increase is consistent with the IPCC’s projections when natural variability is taken into account. In addition, emissions have not been precisely the same as the trajectory used by IPCC, although on this timescale the difference is probably not very significant.

Another early attempt to make policy-relevant projections was published by Hansen et al. in 1988, and results from this work were presented in testimony to the US congress in the same year. Analysis published in 2006 by Hansen et al. demonstrated that the 1988 calculations had been remarkably accurate, with the observed temperatures closely matching those projected under the most realistic emissions scenario. The exceptionally close agreement between the model projections and the observations may have been coincidental since the sensitivity of the climate to carbon dioxide in Hansen’s original model was near the top of the currently accepted range. Nevertheless, the temperature increases projected by the model were close to observations available in 2006.

It is reassuring that these early projections have proved to be of the right magnitude even though the exact rate of warming wasn’t projected. It is worth bearing in mind that the original projections were made about 25 years ago, and the subsequent analysis referenced here was carried out in 2006 and 2010, meaning that only 18-20 years of data is used. This is still not long enough to iron out the full effects of natural variability. Nevertheless, it is now clear that the planet is warming and that humans are responsible, something that could not be concluded unequivocally from the evidence available 25 years ago. It is testament to this overwhelming evidence that those opposed to action on climate change now rely on relatively minor criticisms of climate science to form the basis of their opposition.

Coming to Paterson’s second point, it is indeed true that there has been no significant increase in global surface temperatures in the 21st century so far. However, global warming is not expected to lead to a linear increase in surface temperatures. Indeed, the First Assessment Report of the IPCC, published in 1990, stated that “The [average global surface temperature] rise will not be steady because of the influence of other factors.” Other factors – notably solar cycles, volcanic eruptions and natural climate variation – are known to affect global surface temperatures. The lack of surface temperature increase this century is due to a combination of factors, but almost certainly there has been some contribution from natural changes in the amount of heat taken up by the ocean. It is important to note that the overall heat content of the planet continues to increase and this is still contributing to sea level rise and ice melt.

The impacts of climate change

Paterson continued, “I also note that the forecast effects of climate change have been consistently and widely exaggerated thus far.

“The stopping of the Gulf Stream, the worsening of hurricanes, the retreat of Antarctic sea ice, the increase of malaria, the claim by UNEP that we would see 50m climate refugees before now – these were all predictions that proved wrong.”

There is a hierarchy of uncertainty in climate change prediction. The increase in surface temperatures at a global level due to the greenhouse effect is well understood scientifically. The total amount of heat in the earth system is increasing due to greenhouse gas emissions, which is having the effect of melting ice and snow and warming the ocean, lower atmosphere and Earth surface. All of these impacts, along with ocean acidification from increasing atmospheric carbon dioxide concentrations, are almost certain to continue. Increasing temperatures will also have more complex dynamic effects, including on ocean currents and atmospheric circulation – key aspects of climate variability – as well as on weather patterns, including extreme weather. These impacts are generally harder to predict because there are more factors involved. Putting all of this together and trying to predict the effect of climate change on humans or ecosystems is even more complicated.

The large scale Atlantic Ocean circulation, of which the Gulf Stream forms a part, is driven in part by processes in the North Atlantic that depend on the density of the water in the region.  Polar ice melt and changing rainfall patterns due to climate change both have the effect of depositing relatively fresh (and therefore low density) water in the North Atlantic, meaning this process could be affected by climate change. The possibility of a complete shutdown of this North Atlantic circulation has been discussed based on the results of simplified models that show this as a possible outcome.  However, mainstream scientific consensus has never been that that this is likely. Again, it is worth going back to older IPCC reports, which form the most comprehensive overview of the scientific understanding of climate change at the time they were written. At the time of the IPCC’s Second Assessment Report in 1995, the available models suggested that the ocean overturning circulation would weaken due to climate change. Subsequent reports in 2001 and 2007 also projected a slowdown and discussed the possibility of a shutdown, but neither report predicted a complete shutdown before 2100. By the time of the latest IPCC report in 2013, the overturning circulation was projected to weaken by between 11% and 34% by 2100. A slowdown has not yet been detected in the observations; this is likely due to the significant natural variability in the strength of the overturning circulation and the limited observational record.

There is more than one way that climate change can affect hurricanes (or tropical cyclones more generally). Heavy rain is almost certainly becoming more frequent and intense globally, and this includes rain that falls during tropical cyclones. In addition there could be an effect on wind speeds or on the frequency of tropical cyclones. The IPCC’s Fifth Assessment Report reported observational evidence that the strongest tropical cyclones in the North Atlantic have become more intense and more frequent since the 1970s, although there is no evidence of a global trend.

There has been a global decline in ice and snow due to climate change. Taking sea ice specifically, Arctic and Antarctic Sea Ice have different characteristics. The Arctic sea ice is more long lived and is declining in both area and mass. Antarctic sea ice is not declining in area because the ice is more mobile than in the Arctic meaning its characteristics are more complex. However since its thickness has not been accurately measured, it is not known whether it has gained or lost mass overall. Sea ice is not to be confused with the Greenland and Antarctic ice sheets, both of which are losing mass. This is discussed in more detail in a previous blog.

Coming back to the hierarchy of uncertainty, changes in malaria incidence and the numbers of potential climate refugees are in the most uncertain group of impacts. These changes depend on the detailed changes in climate in the location under discussion and the response of humans or mosquitos/malarial parasites to that. A change in malaria incidence is still possible, but this remains the subject of research. As well as local climate conditions, the number of climate change refugees would also depend on the response from local people, governments or other organisations in adapting to the effects of climate change. The number of unknowns here makes it very difficult to predict how many people might be displaced by climate change, but this does not undermine our confidence in climate science itself.


Paterson misses the point

By Dr Simon Buckle,  Grantham Institute

smoking chimneysOwen Paterson’s remarks on the UK response to climate change miss the point.  I do not disagree with him that the UK decarbonisation strategy should be improved.  In particular, there is a need for a more effective strategy on energy demand.  However, my preferred policy and technology mix would be very different to his and include the acceleration and expansion of the CCS commercial demonstration programme in order to reduce the energy penalty and overall costs of CCS. And without CCS, there is no way responsibly to use the shale gas he wants the UK to produce in the coming decades for electricity generation or in industrial processes, or any other fossil fuels.

However, these are second order issues compared to his call for scrapping the 2050 targets and the suspension of the UK Climate Change Committee.  On current trends, by the end of the century, the surface temperature of our planet is as likely as not to have increased by 4°C relative to pre-industrial conditions.  The present pause in the rise of the global mean surface temperature does not mean we do not need to be concerned.   We are fundamentally changing the climate system, raising the likelihood of severe, pervasive, and irreversible impacts on society and the natural systems on which we all depend.

A cost-effective policy to limit these very real climate risks must be based on concerted, co-ordinated and broad-based mitigation action.  This is needed to deliver a substantial and sustained reduction in global greenhouse gas emissions, which continue on a sharply rising trajectory.  The best way to create the conditions for such action by all the major emitting economies – developed and developing, in different measure – is through the UN negotiation process, supplemented by bodies such as (but not confined to) the Major Economies Forum.  The focus of this process is now on achieving a deal covering emissions beyond 2020, due to be finalised at the Paris summit at the end of next year.

There are encouraging signs of progress, e.g. in both the US and China, and the EU is due to agree its own 2030 targets at the end of this month.  But the process is difficult and protracted.  I agree with Paterson that 2050 is not the be all and end all.  I have argued here that the Paris talks should focus on how the next climate agreement can help us collectively to achieve a global peak in emissions before 2030, the first necessary step to any stringent mitigation target, rather than trying to negotiate a deal covering the whole period to 2050.

If Paris is a success, we might then re-assess whether or not the UK’s current mitigation targets are adequate or not.  But we are rapidly running out of time to achieve what the world’s governments profess to be their aim of limiting global warming to at most 2 degrees Celsius above pre-industrial levels.  The longer we delay mitigation action, the more difficult that challenge will be and the more expensive.  At some point soon it will become impossible in practical terms.

Given its leadership on this issue over many decades, UK action to scrap the Climate Change Act and/or suspend or abolish the Climate Change Committee would be severely damaging.  Seeking short-term domestic political advantage – which is what this move appears to be – through recommendations that would undermine national, European and international efforts to limit climate risks is irresponsible.   Sadly, this seems to be what the so-called political “debate” in the UK has been reduced to.