Week 3: Finalising that server and practicing crossfilter.js and dc.js
In last week’s blog I mentioned that final hurdle for the offline server was to get to the bottom of the disappointingly slow speeds. It took a few days to research around this since no support was found for it on-line. This was not surprising given the specificity of the case and the relatively new service. That being said, this solution is an exciting prospect for charities such as the Red Cross. In fact, my team had discussed the capability of Formhub with the Medecins sans frontieres (MSF) and the MSF immediately put out a request to developers to get this working- it would enable them to digitally collect data in remote and rural areas making the current process a lot more efficient and scalable.
Luckily, learning about web programming in the previous weeks meant I was familiar with Google Chrome’s Developer tools (press Ctrl+Shift+I on Chrome to check them out). This meant I could load up the server and inspect the cause of the delay. It turned out that since Formhub was not originally designed to be used in such a way; the javascript libraries (eg bootstrap, jquery etc) were called upon via the web. I therefore narrowed down the code using these libraries, SSHed into the server, downloaded the libraries in a local storage location and called upon them from within the server . Voila! The server was now running at great speeds.
For rest of the week, I continued to learn about creating interactive dashboards primarily using this tutorial. So I can now make basic line charts linked with pie-charts and so on.
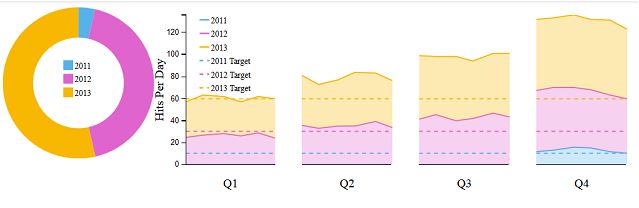
you can check out the actual dashboard and it’s code on this link.
However, I am yet to learn about making click-able maps (as mentioned last week). We are still demoing dashboard ideas to the BRC’s Communications team and although there has been great enthusiasm for them, there have been no substantial requests yet.
So at the end of this week, I am glad to have the Formhub server set-up and will be spending a significant time next week documenting the process of setting it up and creating a “noob-friendly” tutorial. Also, I am looking forward to creating my very own unique dashboard soon!


 ast week of my internship, mixed feelings. I can’t believe time flies so fast, and I am already at the end of the internship. I am pride of myself that I have managed to come to Oxford on my own and accomplished all the work, and even better, I have learned a lot! This was the first time I did internship outside of study, which gave me an insight into the working of global health institute, and my internship here also allowed me to gain ideas of a branch of research which was very distinct from my PhD study, and this meaningful and interesting internship project has opened a new door for me to think about medical science, which probably w ill be combined to what I have done and am doing to build a big picture of research for me in the future. During the work, I have learnt meta-analysis, and a powerful statistical tool-R programming, which will be very useful in my other research. I like the working environment and experience here, people come from different background-clinicians, engineers, philosophers, statisticians, programmers, etc., to share ideas and work efficiently as a team. Everyone is professional, dedicated and nice, they have given me very warm welcome and goodbye, and I really enjoyed the time working with them. They have taught me a lot, not only on techniques and academia, but also on spirit of working.