Author: lmp210

CABI – Week 4


2014-08-19 16.06.18b
Final look at the CABI entrance with the map of all the partner countries where they work.

Well my last week came to a close at CABI. Like many of the other Charity Insight participants have written, I also feel that the experience has been tremendous. In my PhD, I had come across many articles and books written by CABI and so the opportunity to work briefly in their office was a fulfilling personal experience. I also learned a lot from working with Peter Baker about the challenges facing the coffee sector, the other organizations involved, and some of his perceptions on how to address the challenges it is facing.

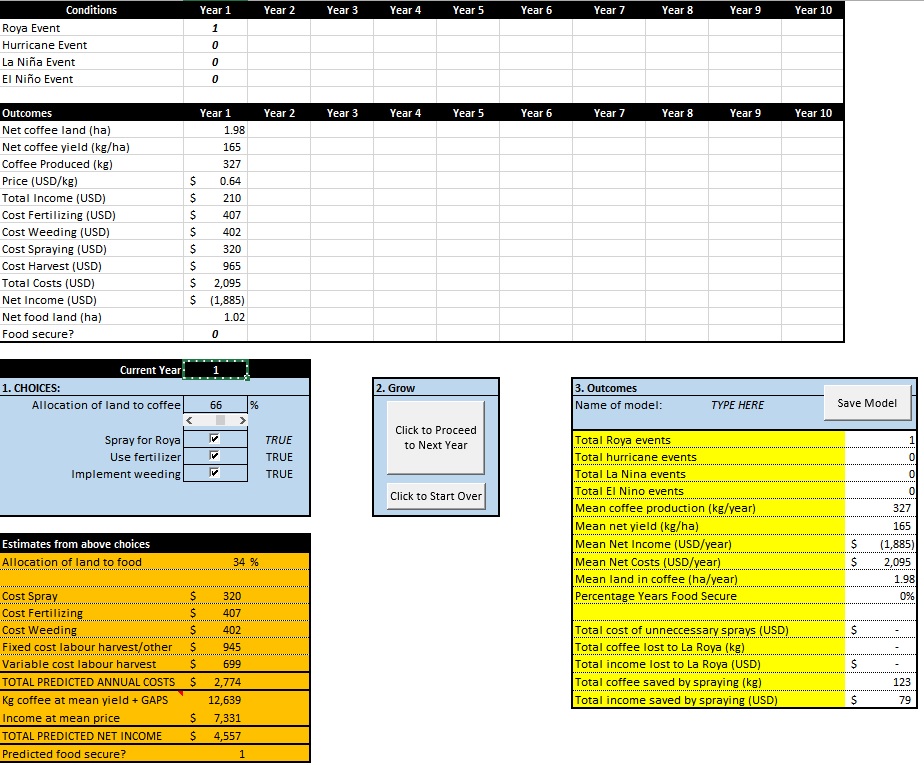
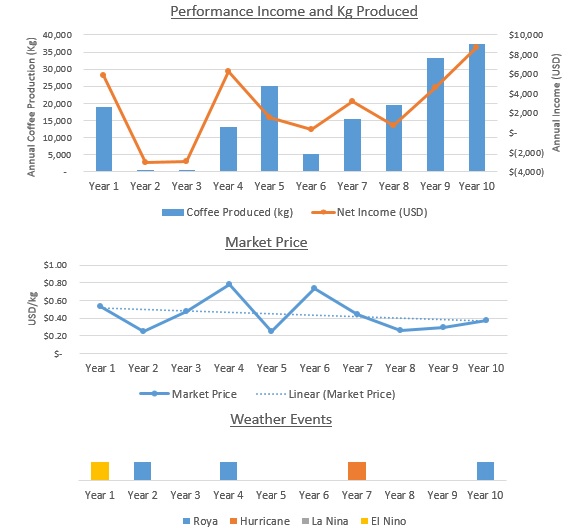
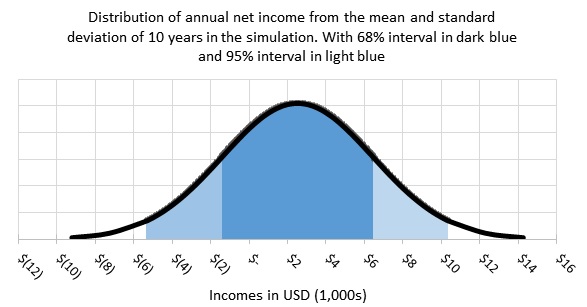
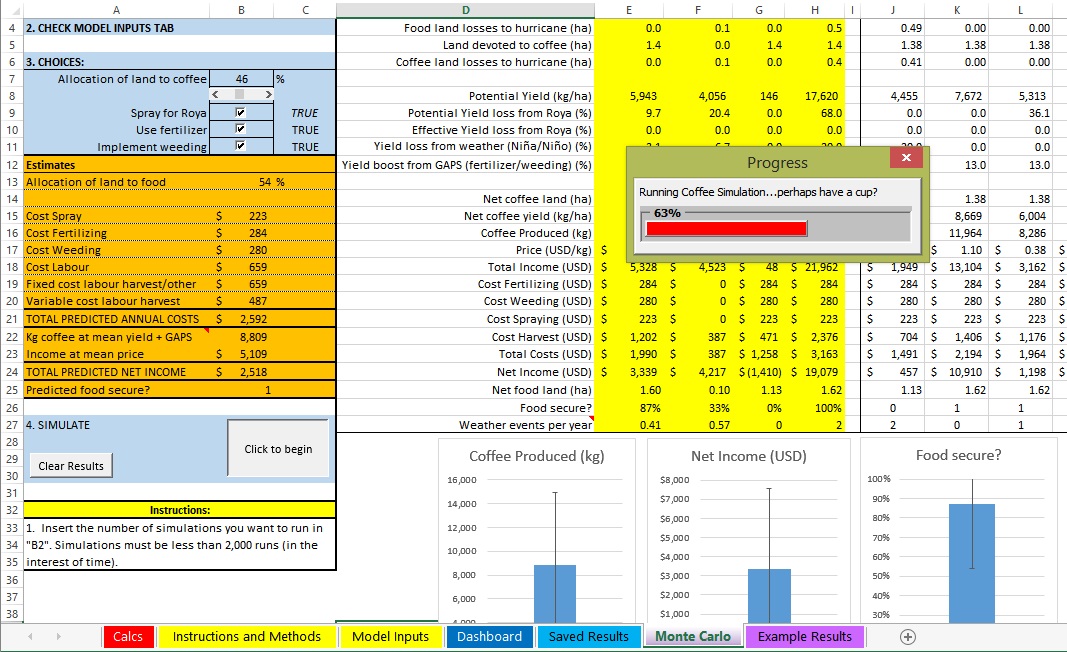
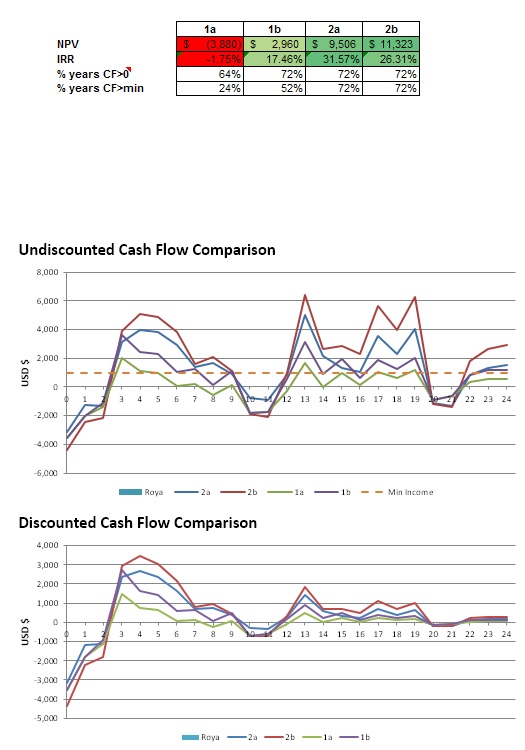
The modelling was very challenging as I had limited experience in Excel VBA and Monte Carlo simulation, however, it is amazing what you can find online to show you the way once you know what you are trying to implement. In my final bit of the internship, I worked with project counterparts at HRNS in Hamburg to add some stochasticity to their cash flow forecasts for different coffee plot scenarios. This work is still ongoing, but I think we have demonstrated the utility of considering decision-making with uncertainty and the potential impact of probabilistic events like Roya. The key is to show stakeholders that farmers face difficult choices when deciding which coffee practices to follow and investments to make on their plots. While a deterministic model quite easily shows the optimum choice is for example certified coffee sales through farmer organizations, adding in uncertainty to price and potential losses due to disease makes the optimal decision dependent on how much risk you can take on and what you believe about the likelihood and severity of a loss event like Roya. This tool is in its infancy, but with development will hopefully aid in the strategy and planning for extension work with coffee farmers.

output
Sample output from one run of the model comparing 4 different coffee plot strategies and their respective IRR, NPV, and metrics of the number of years where the cash flow positive and greater than a minimum income threshold


I’d like to thank Helen and Amy at Imperial for selecting me to participate in this wonderful program. I’ve thoroughly enjoyed my experience and developed some new skills in project management as well as technical skills in Excel. Thanks as well to CABI for hosting me for such a brief period and especially to Peter for all the support throughout this past month.


Thanks for reading! Please get in touch through Linked-in or my imperial address if you work on similar topics or have any questions/comments or want more detail.

Lee

CABI – Week 3

Well week 3 went by fast! Some of the highlights from the week:

  • Presented to some interested CABI staff the preliminary results from our coffee risk modelling endeavours and discussed how to use stochastic methods in Excel.
  • A conference call to a colleague in Germany at HRNS to check in and plan the next steps for where to focus effort
  • Said goodbye to my office mate who is off to Vanautu to teach a farming training course with cocoa producers. 
  • Said goodbye to my supervisor for the week as he was off to Germany and then Colombia for coffee meetings.

People do such an interesting variety of work at CABI and I’ve really enjoyed my time in the office (though I have to say, I think I’d rather be in Vanautu when I look outside 😉 ). I can’t believe there is only this week left. I’ll likely continue on with the modelling and see what we can come up with. This week started with another conference call to Germany and discussion around potentially testing the tool with extension workers in Guatemala. There is a lot of work to do before then and increasingly I feel like I am really pushing myself to the limit of my knowledge. It’s an exciting combination of frustration and little breakthroughs. Time to get back to it!


Cheers,

Lee

CABI – Week two

Week two flew by and I forgot to get a post done by Friday; I thought I’d bash it out this morning. It was an exciting week as I’ve finished a first draft of the simulation in Excel and we are now getting feedback from a few experts. I have a skype call today with a monitoring and evaluation (M&E) expert based in Germany for HRNS to walk-through the model and discuss future steps.

The situation for coffee farmers in Central America has been very tenuous the past few years due to a fungus called Coffee Leaf Rust or La Roya. The New York Times has a great article summarizing and putting faces to the impact with interviews. The difficulty faced by extension agencies and other organizations that are involved with coffee farmers has been what to do about rust immediately, but also, what do we do to encourage resilience and sustainability as our certifications standards alone do not seem to bring these benefits. Some evidence seems to suggest that farmers are switching out of coffee and the concern for many groups is about ensuring a stable supply for the world’s markets as well. Many open questions remain including: how do farmers view and act upon the uncertainties of coffee production? how does the return period for Roya affect the optimal decisions for the coffee farm (e.g. if Guatemala had a Roya outbreak every 3 years, what should farmers do? or if it is every 20 years, what does the system look like then?).

One way to look at these risks is through simulation. In the current model, a user can input many assumptions about various characteristics of the coffee market and coffee farm (e.g. cherry price, plot size, yield loss if roya comes, etc.). Many of these variables are inputed with uncertainty (mean and standard deviation) and excel will sample them from a normal distribution. Currently we have a 10-year model where each year the user can decide whether to fertilize, spray for roya, and how much land to devote to coffee (see below).


dashboard

Each year you can see how your production is going:

performance

At the end of the 10 year period, you can see how you performed, with your results for income (for instance) plotted as a distribution of likely outcomes:

examplenormdist

Another set of modelling is to keep the same decisions on fertilizing, plot allocation to coffee, and spraying and simulate for a sample of up to 2,000 runs to get an idea of the possible set of outcomes given the assumptions you have made about production. A screenshot of running this simulation is below:

simulation


The model is quite simple at this point and needs more realistic assumptions drawn from actual data about the input variables, but that will be some of the work this week. It would also be great to add in some of the information farmers might receive before making decisions on the plot, we can then use the 10-year simulation to play with farmers to elicit how they respond to simulated weather events. Getting a better understanding of decision-making at the farm-level can hep to design better policies to mitigate the impact of devastating crop losses.


Until next time, Lee


PS. Find me on linked-in or comment below if you have thoughts or suggestions.

First week at CABI!

Today completes my first week at CABI. I knew CABI was a bit outside London, but the walk from the train station in Egham this week has been a welcome surprise. The forested areas around CABI are fantastic and make for such a pleasant walk to work. I got lost in the forest on Thursday and ended up going further than the public path I was meant to take; I was a bit late for work, but the sights, sounds, and pleasantness of the woods reminded me why I have no love affair with living in London.

On to the work! I met with Peter Baker, the coffee expert of CABI, and we further defined the goals of my work for the next month. There are some MSc students I am getting data from this weekend and I hope to continue with some of the brilliant work they’ve started on. I’ll save a full summary of the background of the work for a later post, but in short we are working with HRNS to (1) analyse the coffee production data in Guatemala, Honduras, and El Salvador to see the impacts of Coffee Leaf Rust, and (2) develop a model/simulation/game based on the results to explore how farmers and extension agents respond to climate and other market risks. While I don’t have the “right” numbers to fill in, I decided to follow the fail quickly paradigm and started drafting a model in excel on the first day. Here is where it is at on Friday and we’ll see where we want to take it next. My knowledge of VBA and creating user input forms on excel has greatly improved this week.

Until next week, Lee