Week two flew by and I forgot to get a post done by Friday; I thought I’d bash it out this morning. It was an exciting week as I’ve finished a first draft of the simulation in Excel and we are now getting feedback from a few experts. I have a skype call today with a monitoring and evaluation (M&E) expert based in Germany for HRNS to walk-through the model and discuss future steps.
The situation for coffee farmers in Central America has been very tenuous the past few years due to a fungus called Coffee Leaf Rust or La Roya. The New York Times has a great article summarizing and putting faces to the impact with interviews. The difficulty faced by extension agencies and other organizations that are involved with coffee farmers has been what to do about rust immediately, but also, what do we do to encourage resilience and sustainability as our certifications standards alone do not seem to bring these benefits. Some evidence seems to suggest that farmers are switching out of coffee and the concern for many groups is about ensuring a stable supply for the world’s markets as well. Many open questions remain including: how do farmers view and act upon the uncertainties of coffee production? how does the return period for Roya affect the optimal decisions for the coffee farm (e.g. if Guatemala had a Roya outbreak every 3 years, what should farmers do? or if it is every 20 years, what does the system look like then?).
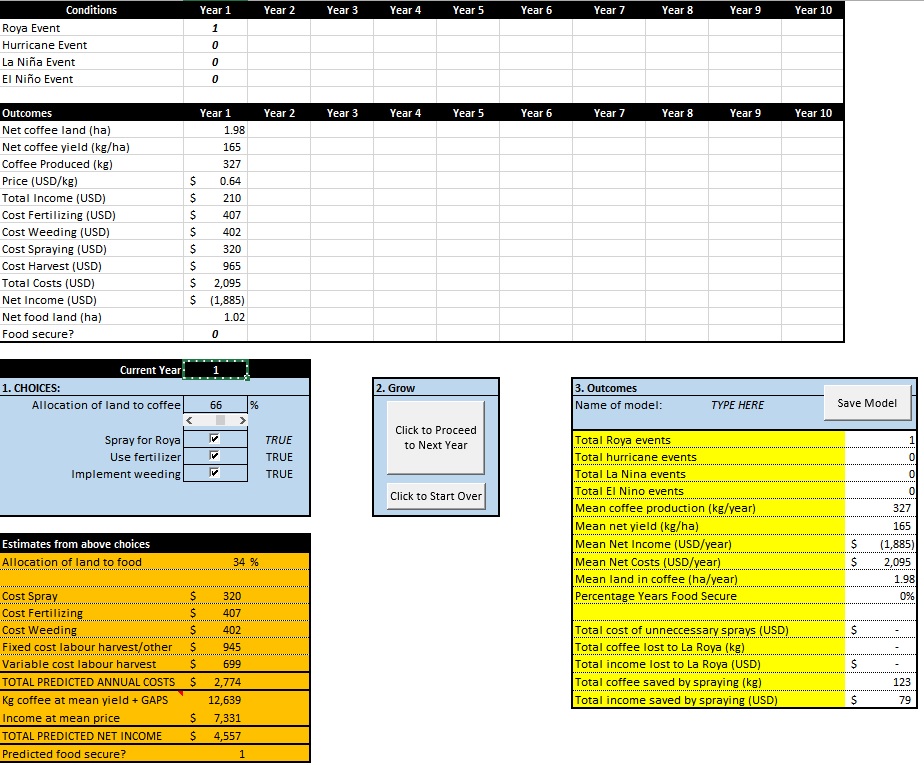
One way to look at these risks is through simulation. In the current model, a user can input many assumptions about various characteristics of the coffee market and coffee farm (e.g. cherry price, plot size, yield loss if roya comes, etc.). Many of these variables are inputed with uncertainty (mean and standard deviation) and excel will sample them from a normal distribution. Currently we have a 10-year model where each year the user can decide whether to fertilize, spray for roya, and how much land to devote to coffee (see below).
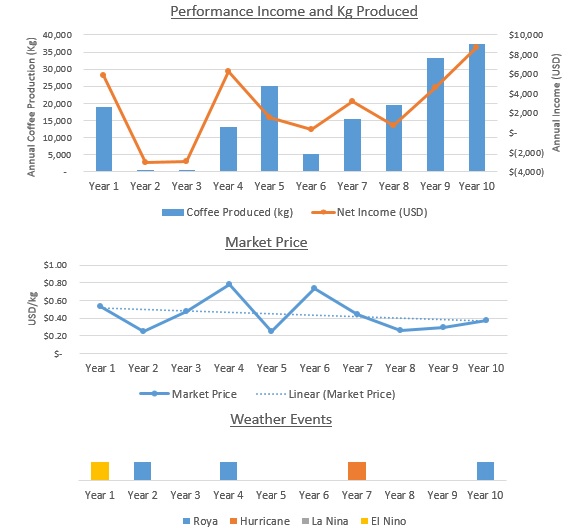
Each year you can see how your production is going:
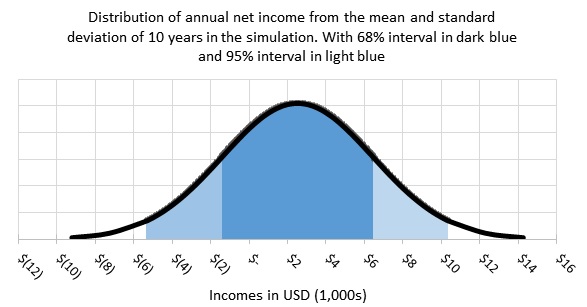
At the end of the 10 year period, you can see how you performed, with your results for income (for instance) plotted as a distribution of likely outcomes:
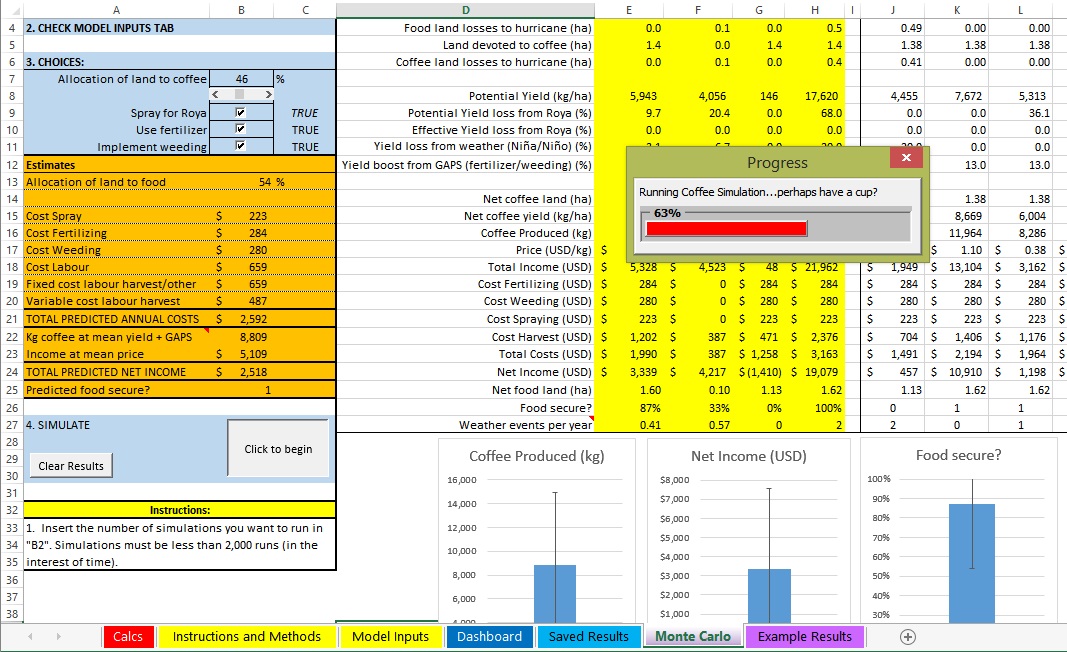
Another set of modelling is to keep the same decisions on fertilizing, plot allocation to coffee, and spraying and simulate for a sample of up to 2,000 runs to get an idea of the possible set of outcomes given the assumptions you have made about production. A screenshot of running this simulation is below:
The model is quite simple at this point and needs more realistic assumptions drawn from actual data about the input variables, but that will be some of the work this week. It would also be great to add in some of the information farmers might receive before making decisions on the plot, we can then use the 10-year simulation to play with farmers to elicit how they respond to simulated weather events. Getting a better understanding of decision-making at the farm-level can hep to design better policies to mitigate the impact of devastating crop losses.
Until next time, Lee
PS. Find me on linked-in or comment below if you have thoughts or suggestions.