It is hard to believe that I am writing my final blog post already. At the same time, I am glad with the things I have learnt and implemented in these last few weeks.
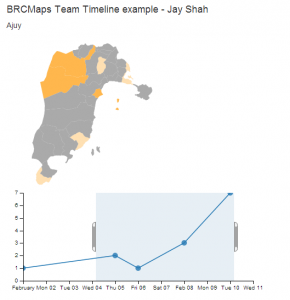
I spent the first few days making my first dashboard! The team wanted to know if there was a way to have a timeline which would visualize the spread of incidences on a map. They foresee it to be an important visualization for the recent Ebola outbreaks. So after creating my own fake data set and digging around online, I was able to create this in the first few of days of the week.
The visualization allows you to choose one or multiple dates and sends the selected data on a map coloring the relevant districts in varying hue depending on the number of incidences. One of the major obstacle for this code was to enable both the selector and the data points (represented by dots) at the same time. After posting the question online on the dc.js usergroup I was able to work out a solution for that.
The rest of the week was spend on documenting all my work on the local Formhub server. I had to create a guide to setting up another server from scratch and a user manual assuming very basic technical knowledge for the server, after its set-up.
I have had a very productive time here at the British Red Cross and this week has really helped me substantiate the things I have learnt and done over the last 4 weeks. The team assured me that they would be keen on having more students from ICL in coming years and I obviously recommend it too!
