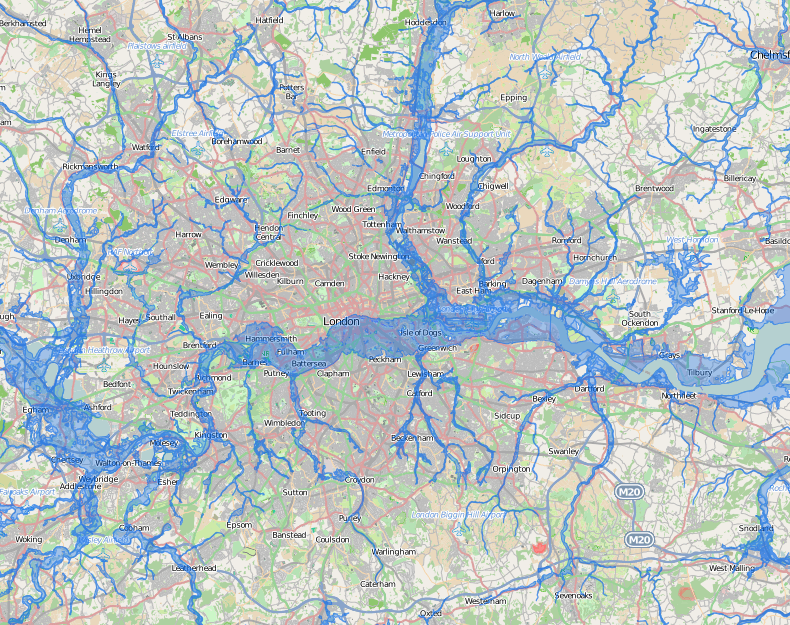
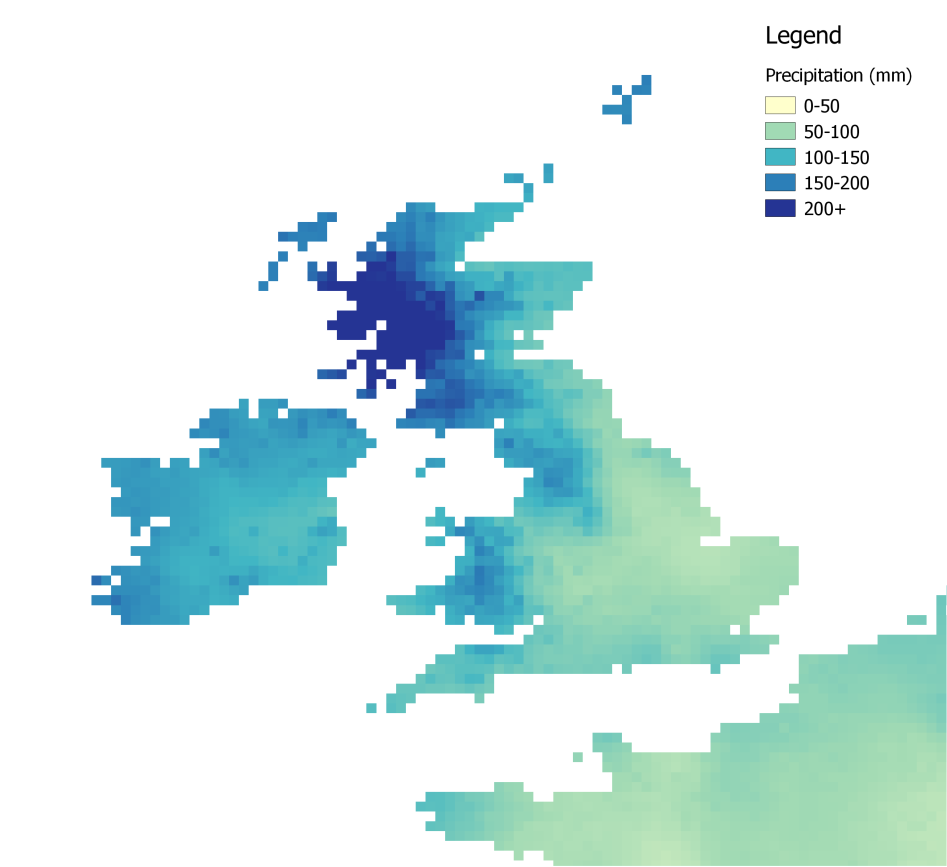
In my final week here at the Red Cross, I have been finding out more about using maps for disaster risk management. Maps are used in a range of situations in the disaster risk management cycle, from pre-disaster prevention to post-disaster recovery. This will be the topic of my final blog.
Understanding vulnerability using maps
Rapid population growth and unplanned urbanisation, combined with extreme climate events are causing an increase in vulnerability of communities exposed to disasters.
This means there is a great need to use information to plan ahead. With the internet and new technologies, a vast amount of information is now available to use.
Opensource GIS software is available online for free from QGIS. This means it can easily be used by volunteers at home and overseas anywhere in the world.
Spatial information also opens up better communication – because when people visualise the risk on a map it often becomes more ‘real’ to them.

For example, climate and weather forecasts are available from decades to days ahead (although these vary in accuracy). They can be used to issue ‘early warnings’ like the warning issued by the Met Office in the UK before the major storm on 27th October.

Climate change projections are available online from CCAFS and from the World Bank.
Disaster prevention and preparedness is aided by knowing where the vulnerable people and infrastructure are, and where disasters have happened in the past, so these areas can be targeted.
Maps help with disaster response and recovery
After a disaster, maps can help with relief and recovery. Satellite imagery can be used assess the situation, and maps can be used to find the quickest route to an affected place.
Maps can also be used to assess loss and damage from a disaster, for example, in building damage assessments.
I have had an amazing experience working at the British Red Cross and learnt a lot. It has been an insight into the great work done by the Red Cross, both abroad and in the UK, including all the staff and volunteers. A massive thanks to everyone I met at British Red Cross!